![Report: Comparison of standardization & geocoding services [ranking]](https://algolytics.com/wp-content/uploads/2026/06/pexels-googledeepmind-17485657-4-1024x576.jpg)


 2 minutes
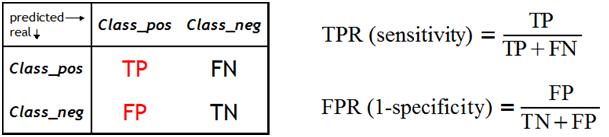
The ROC curve is one of the methods for visualizing classification quality, which shows the dependency between TPR (True Positive Rate) and FPR (False Positive Rate).
In the previous parts of our tutorial we discussed:
- Basic notation used in assessing classification models
- Quantitative quality indicators
- Confusion Matrix
In this fourth part of the tutorial we will discuss the ROC curve.
What is the ROC curve?
The ROC curve is one of the methods for visualizing classification quality, which shows the dependency between TPR (True Positive Rate) and FPR (False Positive Rate).
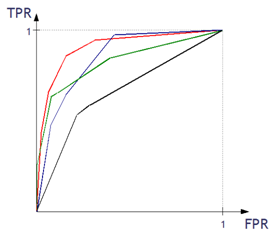
The more convex the curve, the better the classifier. In the example below, the „green” classifier is better in area 1, and the „red” classifier is better in area 2.
How is the ROC curve created
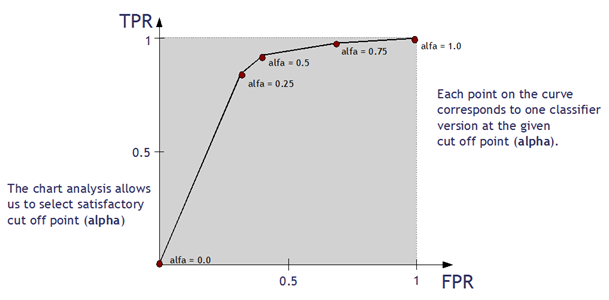
- We compute the values of the decision function.
- We test the classifier for different alpha thresholds. Recall that alpha is the threshold of the estimated probability, above which an observation is assigned to one category (positive class) and below to the other category (negative class).
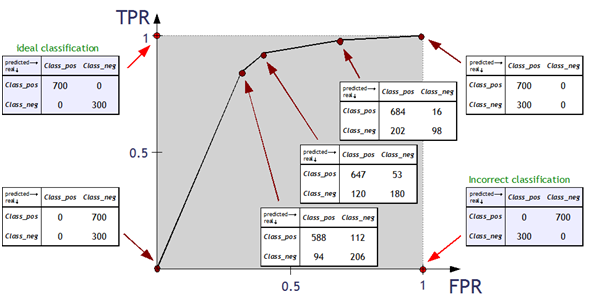
- For each classification with one value of the alpha threshold we obtain a (TPR, FPR) pair, which corresponds to one point on the ROC curve.
- For each classification with one value of the alpha threshold we also have the corresponding Confusion Matrix.
Example:
Assessing the classifier on the basis of the ROC curve
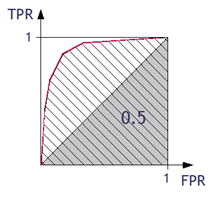
The quality of classification can be determined using the ROC curve by calculating the:
- area under ROC Curve (AUC) coefficient
The higher the value of AUC coefficient, the better. AUC = 1 means a perfect classifier, AUC = 0.5 is obtained for purely random classifiers. AUC < 0.5 means the classifier performs worse than a random one.
- Gini Coefficient: GC = 2 *AUC – 1 (the classifier’s advantage over a purely random one)
The higher the value of GC, the better. GC = 1 denotes a perfect classifier, GC = 0 denotes a purely random one.
The last part of our tutorial will be dedicated to LIFT curve.