
How to determine the quality and correctness of classification models? Part 2 – Quantitative quality indicators
In this part of tutorial we will discuss derived quality indicators and show how to select the appropriate indicator using as an example churn analysis.
Basic quantitative quality indicators
In the first part of the tutorial we introduced the basic qualitative model quality indicators. Let us recall them now:
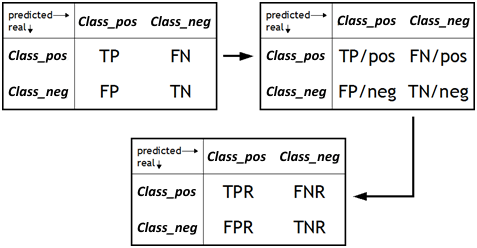
- TP – True Positive – the number of observations correctly assigned to the positive class
Example: the model’s predictions are correct and resigning customers have been assigned to the class of „disloyal” customers
- TN – True Negative – the number of observations correctly assigned to the negative class
Example: the model’s predictions are correct and customers who continue using the service have been assigned to the class of „loyal” customers.
- FP – False Positive – the number of observations assigned by the model to the positive class, which in reality belong to the negative class.
Example: unfortunately the model is not perfect and made a mistake: some customers, who continue using the service have been assigned to the class of „disloyal” customers.
- FN – False Negative – the number of observations assigned by the model to the negative class, which in reality belong to the positive class.
Example:unfortunately the model is not perfect and made a mistake: some churning customers have been assigned to the class of „loyal” customers.
Derived quality indicators
We will now discuss derived variants of these indicators.
- TPR (True Positive Rate) – reflects the classifier’s ability to detect members of the positive class (pathological state)
TPR = TP / (TP + FN)
- TNR (True Negative Rate) – reflects the classifier’s ability to detect members of the negative class (normal state)
TNR = TN / (TN + FP)
- FPR (False Positive Rate) – reflects the frequency with which the classifier makes a mistake by classifying normal state as pathological
FPR = FP / (FP + TN)
- FNR (False Negative Rate) – reflects the frequency with which the classifier makes a mistake by classifying pathological state as normal
FNR = FN / (FN + TP)
- SE (sensitivity) – reflects the classifier’s ability to detect members of the positive class (pathological state)
SE = TP / (TP + FN)
- SP (specificity) – reflects the classifier’s ability to detect members of the negative class (normal state)
SP = TN / (TN + FP)
Note that the following equalities hold:
SE = TPR 1 – SE = FNR
SP = TNR 1-SP = FPR
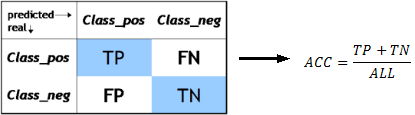
- ACC (Total Accuracy) – reflects the classifier’s overall prediction correctness, i.e. the probability of making the correct prediction, equal to the ration of the number of correct decision to the total number of decisions
ACC = (TP + TN) / (TP + TN + FP + FN)
Example: how to select the appropriate indicator
There are numerous measures of classifier quality and it is necessary to select the one which is appropriate for the situation at hand.
Example
During churn analysis we have two classes in the data: churn and no churn. There are 100 observations in the data and
- 90 observation belong to the class labeled as “0” (the positive class), which consists of customers who decided to stop using our services or products,
- 10 observation belong to the class labeled as “1” (the negative class), which consists of customers who continue to use our services or products.
For a certain classifier we obtain:
TP = 85 (85 churning customers have been classified as)
TN = 1 (1 not churning customer has been classified as such)
FP = 9 (9 not churning customers have been classified as churning)
FN = 5 (5 churning customers have been classified as not churning)
The sum of the above indicators equals the number of observations (customers):
TP + TN + FP + FN = 100
We now calculate the total accuracy of the classifier:
ACC = (85+1)/100 = 0,86
86 cases out of 100 has been correctly classified, which is not a bad result at all.
However, let us take a look at another indicator, the TNR, which reflects the classifier’s ability to detect the negative class, or, in our case, not churning customers:
TNR = 1/10 =0,1
Only a single observation from the negative class has been correctly classified as such (i.e. 1 customer who did not churn has been classified as not churning, and the remaining not churning customers has been classified as churning!).
Conclusion: ACC cannot be used to determine the extent to which the classes can be identified by the classifier.