![Report: Comparison of standardization & geocoding services [ranking]](https://algolytics.com/wp-content/uploads/2026/06/pexels-googledeepmind-17485657-4-1024x576.jpg)


 9 minutes
For an address to be ready for automated processing, it first has to be brought into a usable form - and that's exactly what standardization services (which tidy up how it is written, creating a key for linking data) and geocoding services (which assign coordinates, placing the address on the map) are for. These services differ in quality, however, and being good on one dimension does not mean being good on the other: the same service can return a nicely standardized address yet place its coordinates in a different building - or hit the right spot but record the address in a form that is unusable in your processes. That is why, in our report “Address as the main key for linking data” we compared 10 such services on 2,500 real addresses taken from courier shipments. In this article we show how they perform on standardization and geocoding, and what to watch for when choosing a provider.
Why standardization and geocoding have to be assessed separately
Standardization and geocoding are responsible for two different things. Standardization “produces the key” - it breaks a raw address into components, reconciles the various ways it can be written, and then reassembles it into a repeatable, predictable form that can be indexed, deduplicated, and matched across systems. Geocoding anchors the address in space - it assigns coordinates that make it possible to automatically assign the address to a district, a service area, the nearest branch, or a route. Coordinates on their own, however, make a poor primary key: the same building can be geocoded to its centroid, its entrance point, or the center of its parcel, so two correct results can look like different values. Both dimensions therefore have to be measured separately, and checked for whether they go hand in hand.
The common point of reference in our analysis was a golden set: for each of the 2,500 records we established a single benchmark form of the address and a single reference location, consistent with the TERYT, EMUiA, and PNA registers. The sample covered 1,197 urban addresses and 1,253 rural ones, and we excluded 50 unrecognizable records from the rankings so as not to conflate the quality of the input data with the quality of the services themselves.
Standardization - is the address fit to serve as a key for linking data?
The standardization index measures how useful an address actually is as a key. It is made up of: how well the address components match the golden set (locality, street, postal code, building number, and unit number - with the greatest weight on the building number and the street), the share of records that are fully correct across all components, consistency with TERYT, and the completeness of the returned fields.
The top performers are the local providers - Data Quality (0.98), our own service, and Locit (0.95). Both faithfully reproduce the components of a Polish address and stay consistent with the registries - no surprise, given that they are built in Poland and tailored to the national addressing system. Among the global providers, the best is Google (0.80), but with a markedly lower share of fully correct records, which in practice means more cases that require manual completion on the customer's side.
The remaining global providers - HERE, Azure, TomTom, and Mapbox - share a similar profile: high field completeness alongside moderate consistency with the reference registers. The biggest problem is not missing data but the semantics of the administrative fields. At Azure and TomTom, the municipality and municipalitySubdivision fields can denote a gmina, a locality, or a district, and are sometimes empty; at Esri, the “City” field often behaves like the municipality name; and Google has no municipality in its administrative model at all and returns voivodeship names in a form inconsistent with the TERYT register. Every such case means extra mapping logic on the client side - a real implementation cost, even if it never appears on the price list.
A recurring pattern is also visible: most services standardize worse in rural areas than in cities, because rural addresses often have no division into streets, and many providers do not handle this correctly - leaving, for example, the locality name repeated in the street-name field.
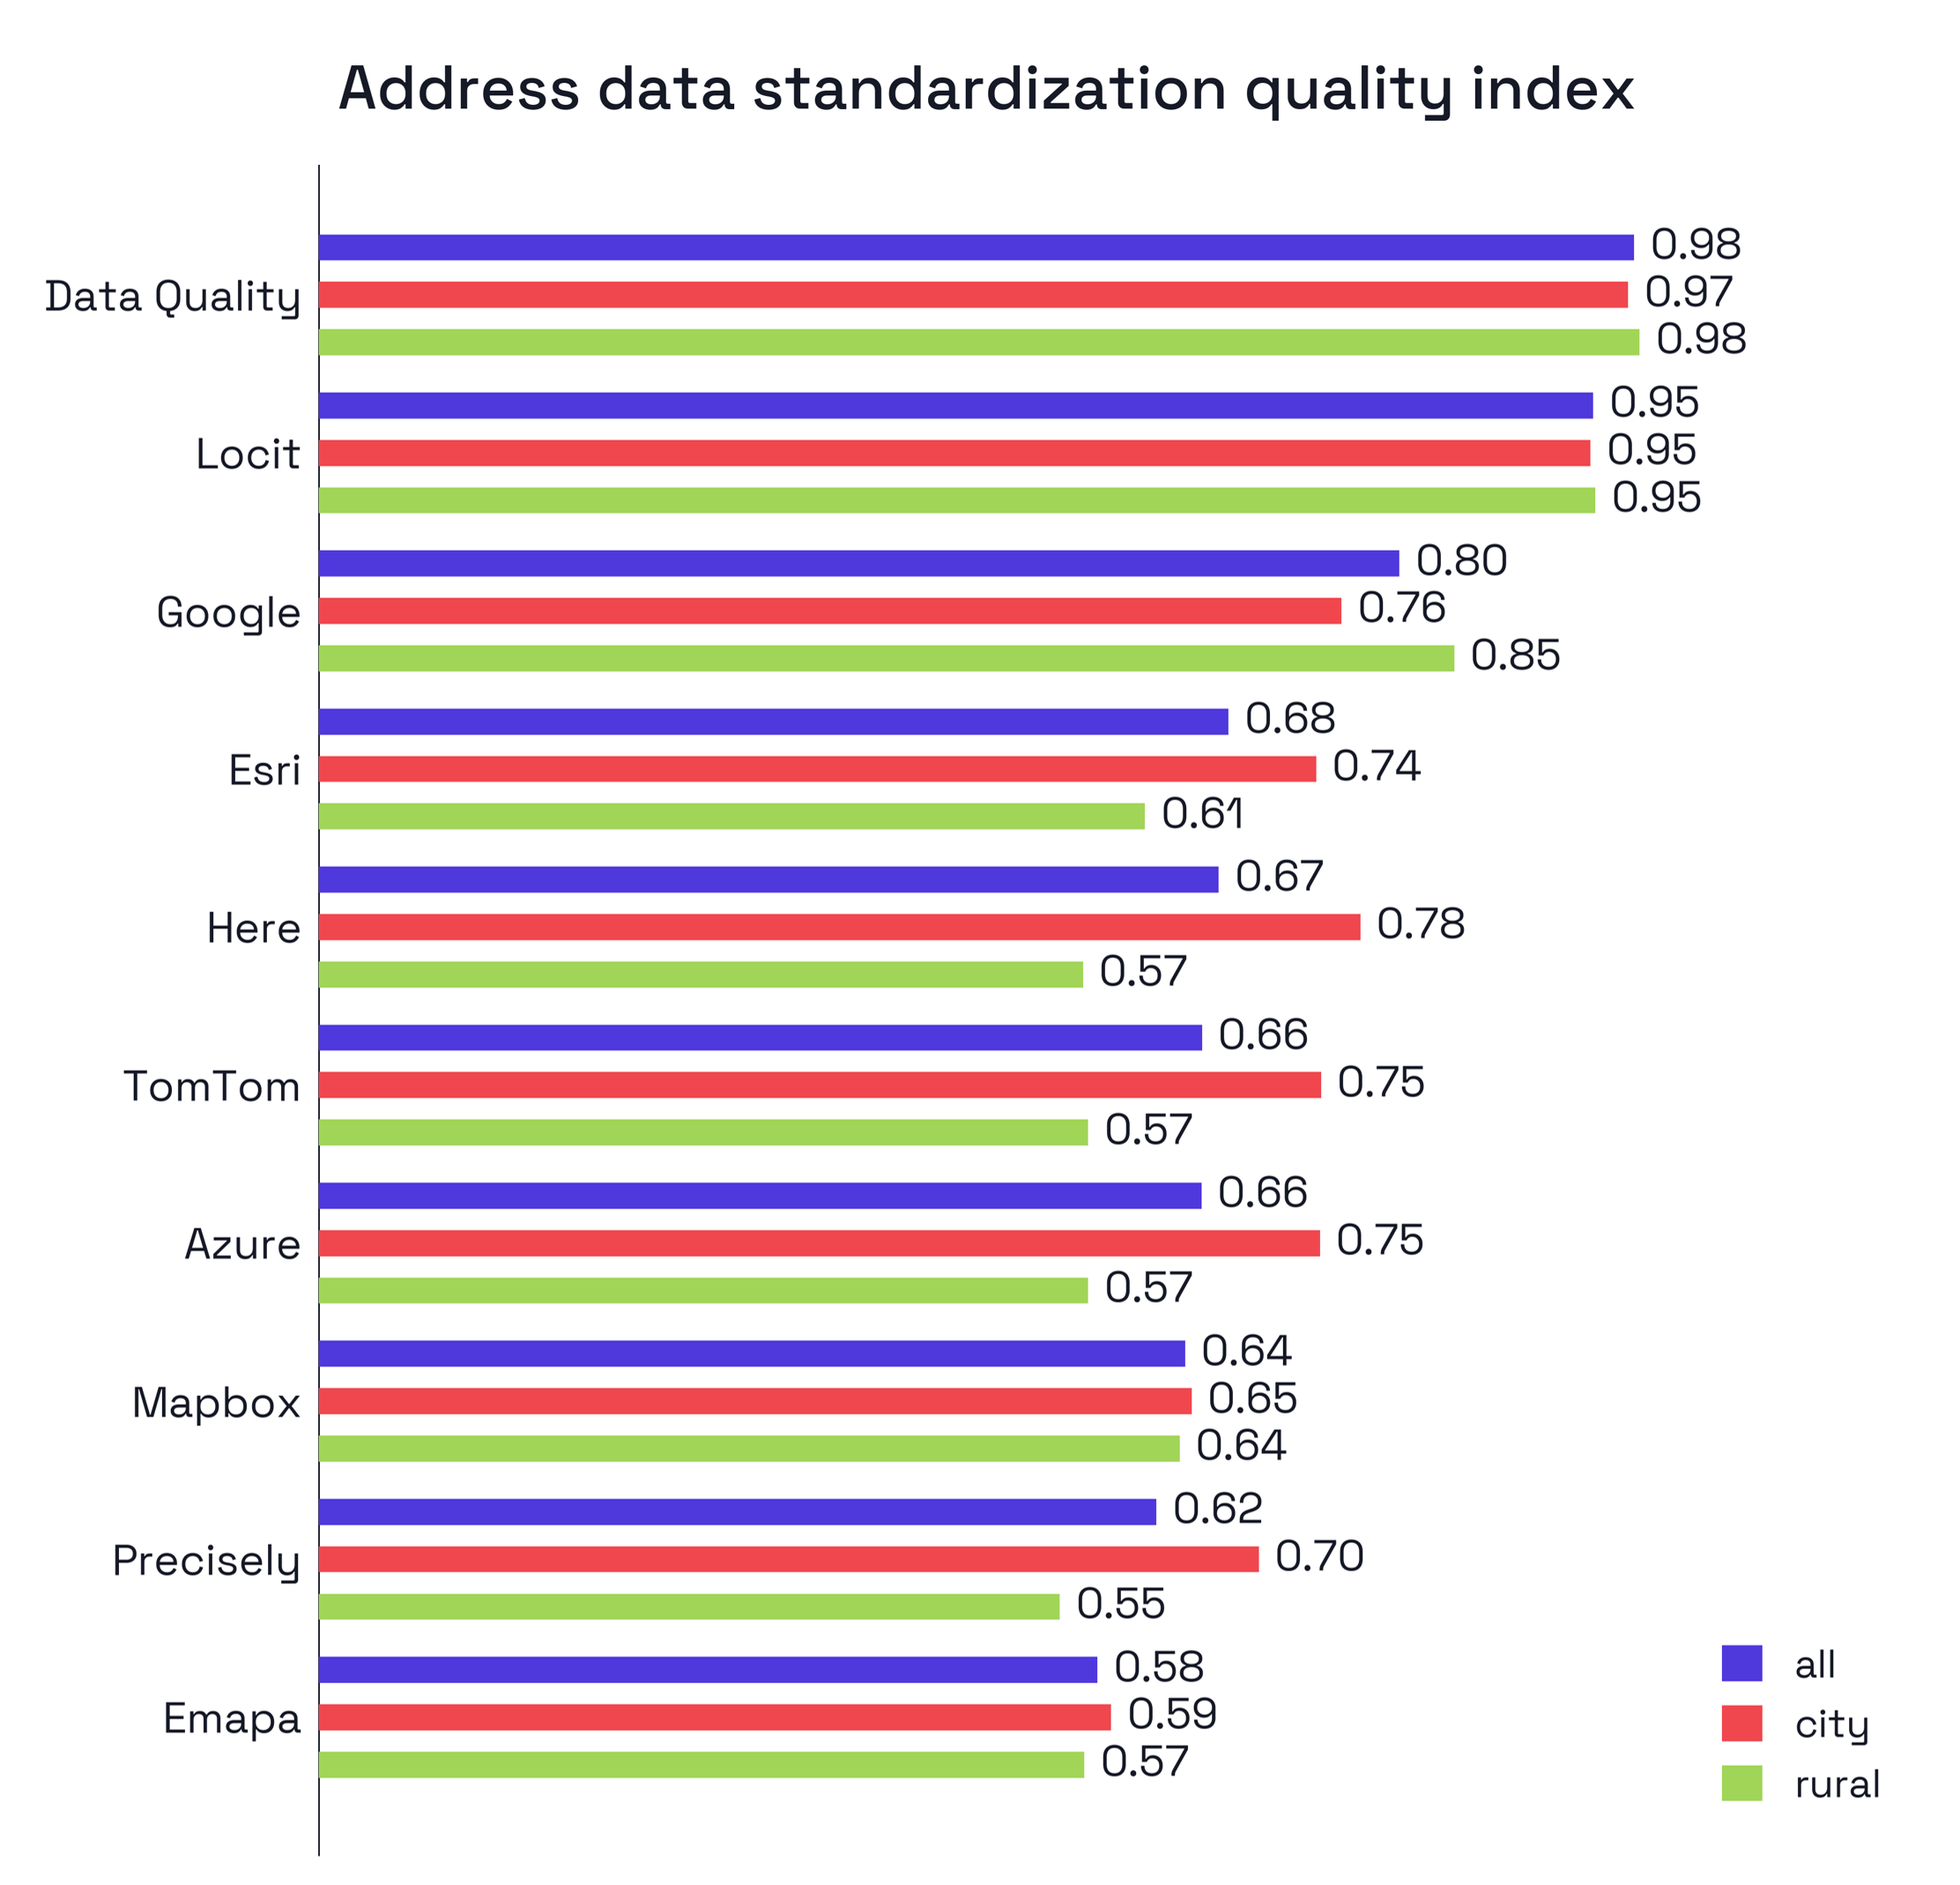
Standardization index - the higher the value, the more accurate the standardization and the better the address serves as a key for linking data (maximum = 1.0).
Geocoding - does the address point to the right place?
In geocoding, what counts is not average accuracy but the behavior of the tail of the distribution - the rare but large errors that can be the costliest in automated processes. That is why we base the geocoding index primarily on the 95th percentile of the positional error (P95) and the share of errors above 1 km, complemented by the share of hits within a 100 m radius.
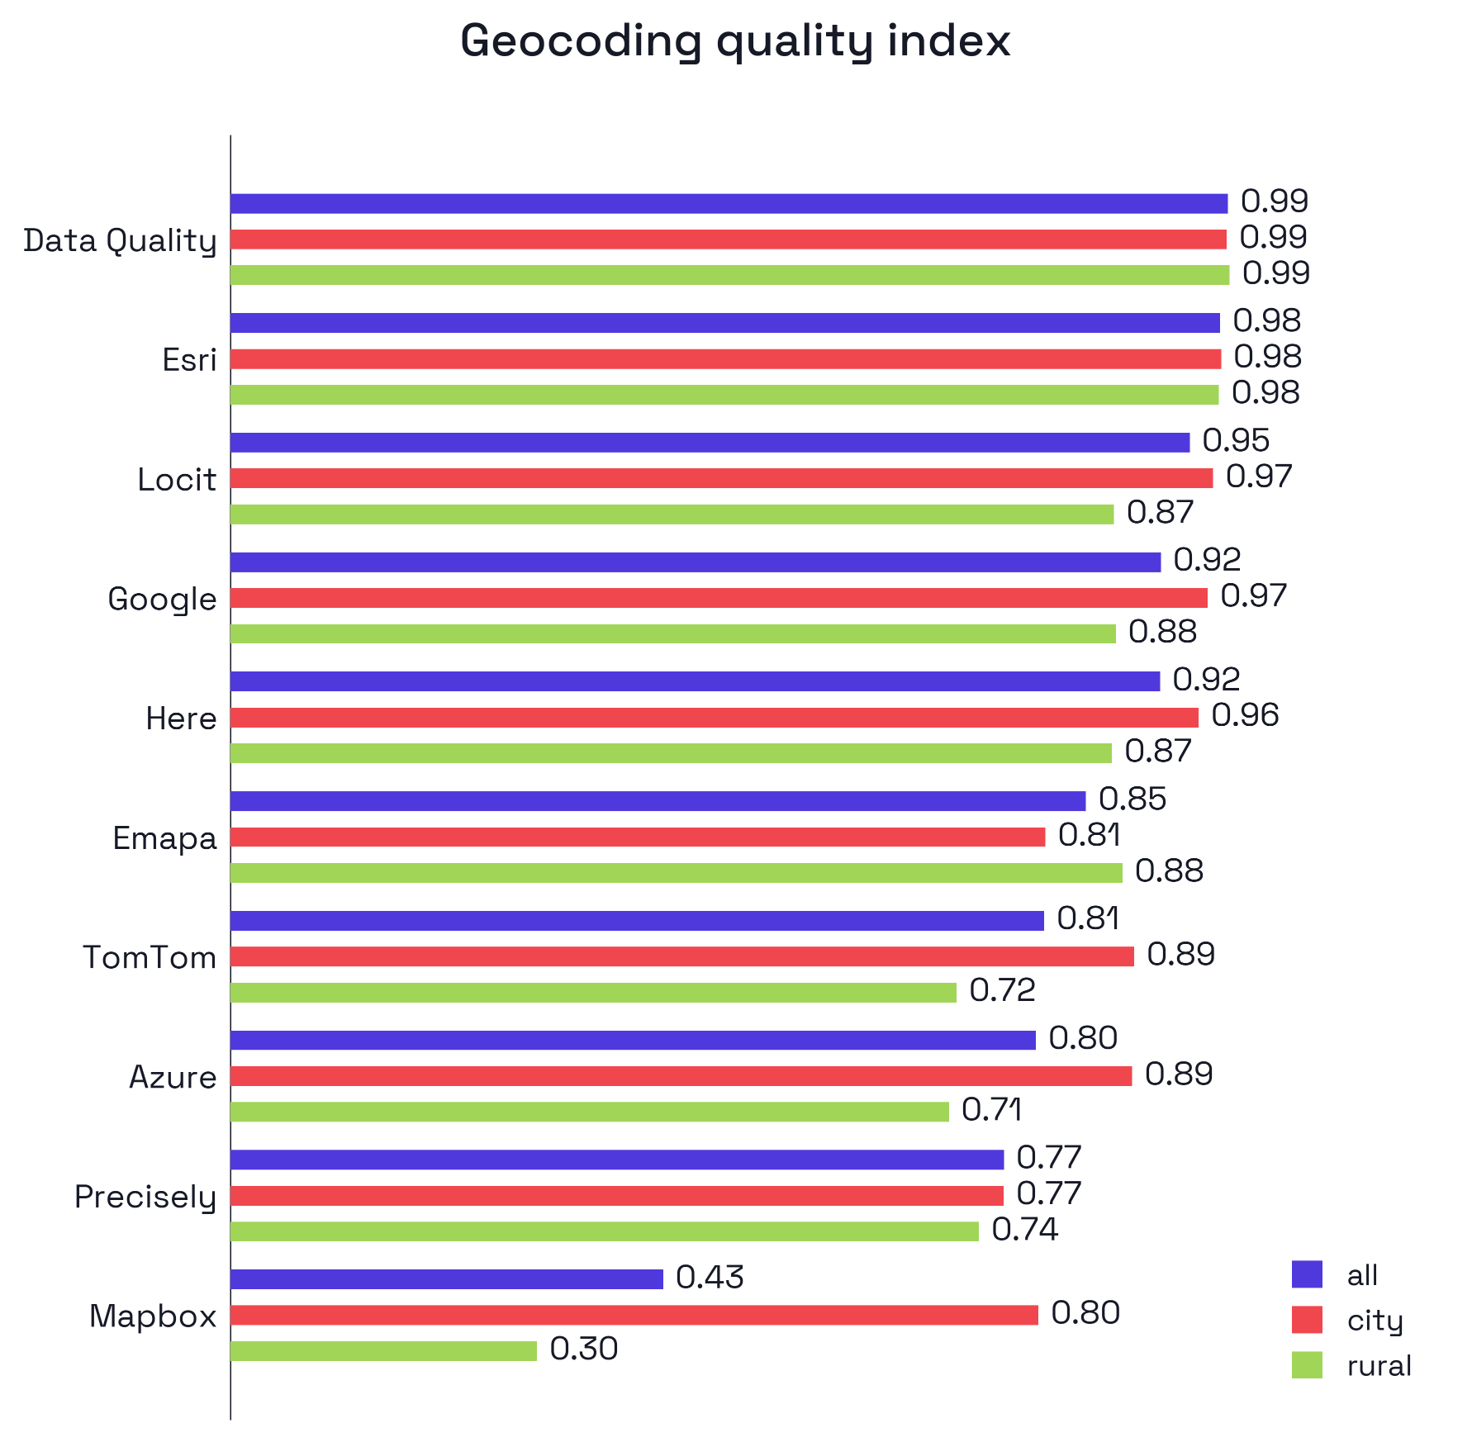
Geocoding index - the higher the value, the more reliable the address location and the more confidently you can base location-dependent decisions on it (maximum = 1.0).
The best profiles belong to Data Quality (0.99) and Esri (0.98) - a very high share of hits within 100 m alongside a minimal error tail; the second strong group is made up of Locit (0.95).
The scale of the differences shows up clearly in the P95: for Data Quality the error is practically zero, Esri is at 0.066 km, Locit at 0.341 km, and Google and HERE sit around 0.9 km. Beyond that it gets expensive - Azure, TomTom, and Precisely have a P95 on the order of 3 km, and Mapbox as much as 172 km. That is no longer “imprecision” but pointing to an entirely different place.
![95th percentile of the geocoding error [km] – the lower, the better (for 95% of addresses the error is smaller than this value).](https://algolytics.com/wp-content/uploads/2026/08/Obraz5.png)
95th percentile of the geocoding error [km] – the lower, the better (for 95% of addresses the error is smaller than this value).
This feeds directly into the share of serious errors. At Google and HERE, about 5% of results exceed 1 km - in an automated process, every such record can land in the wrong zone or district. At Azure and TomTom it is already around 10%, and the weakest performers are Mapbox and Precisely.
The pattern repeats once again: in rural areas the error tail grows for almost every service.
Good standardization does not mean good geocoding
Interestingly, good standardization does not mean a service geocodes well - and vice versa. The clearest example is Esri: on geocoding it is the second-best service in the entire sample (a P95 of just 0.066 km), but its standardization is noticeably weaker - the “City” field gets confused with the gmina, and the auxiliary fields are populated inconsistently. The result? A precise point on the map, and an address that cannot be used as a key for linking data without extra work. In the overall ranking, then, Esri lands only mid-table (SCORE of 0.637).
The reverse happens too. With Google, there were cases where the standardized address looked correct while the coordinates pointed to a different building - good record, wrong location. This shows why a single, averaged “quality score” can be misleading: a service can be strong on one dimension and risky on the other.
Only Data Quality and Locit come out on top on both dimensions at once - which is why they lead the overall ranking (0.938 and 0.893).
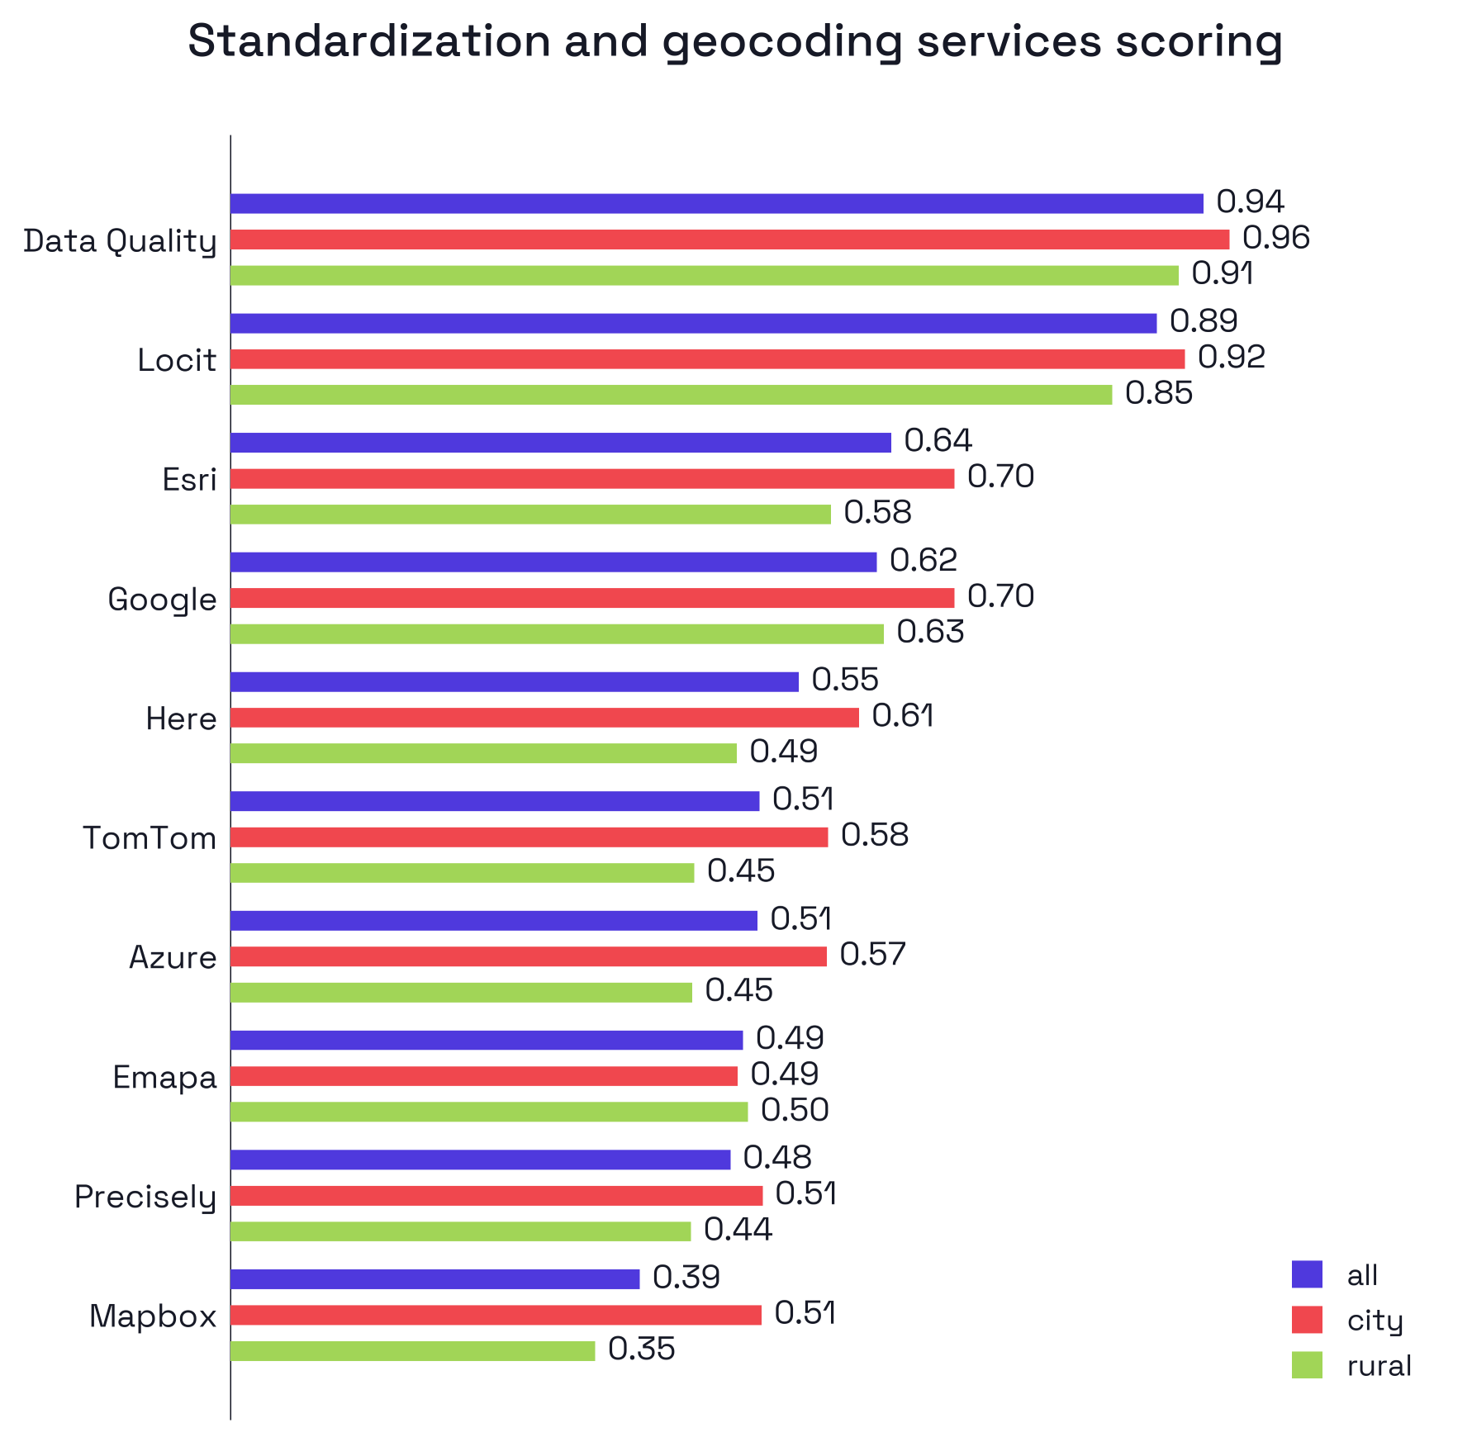
Overall ranking (SCORE), combining standardization, geocoding, and trust - the higher the value, the better the service (maximum = 1.0).
A separate analysis of address–point consistency confirms this: even among records that are correct on location (error below 50 m), fully correct standardization goes hand in hand with it above all among the local providers (Data Quality and Locit).
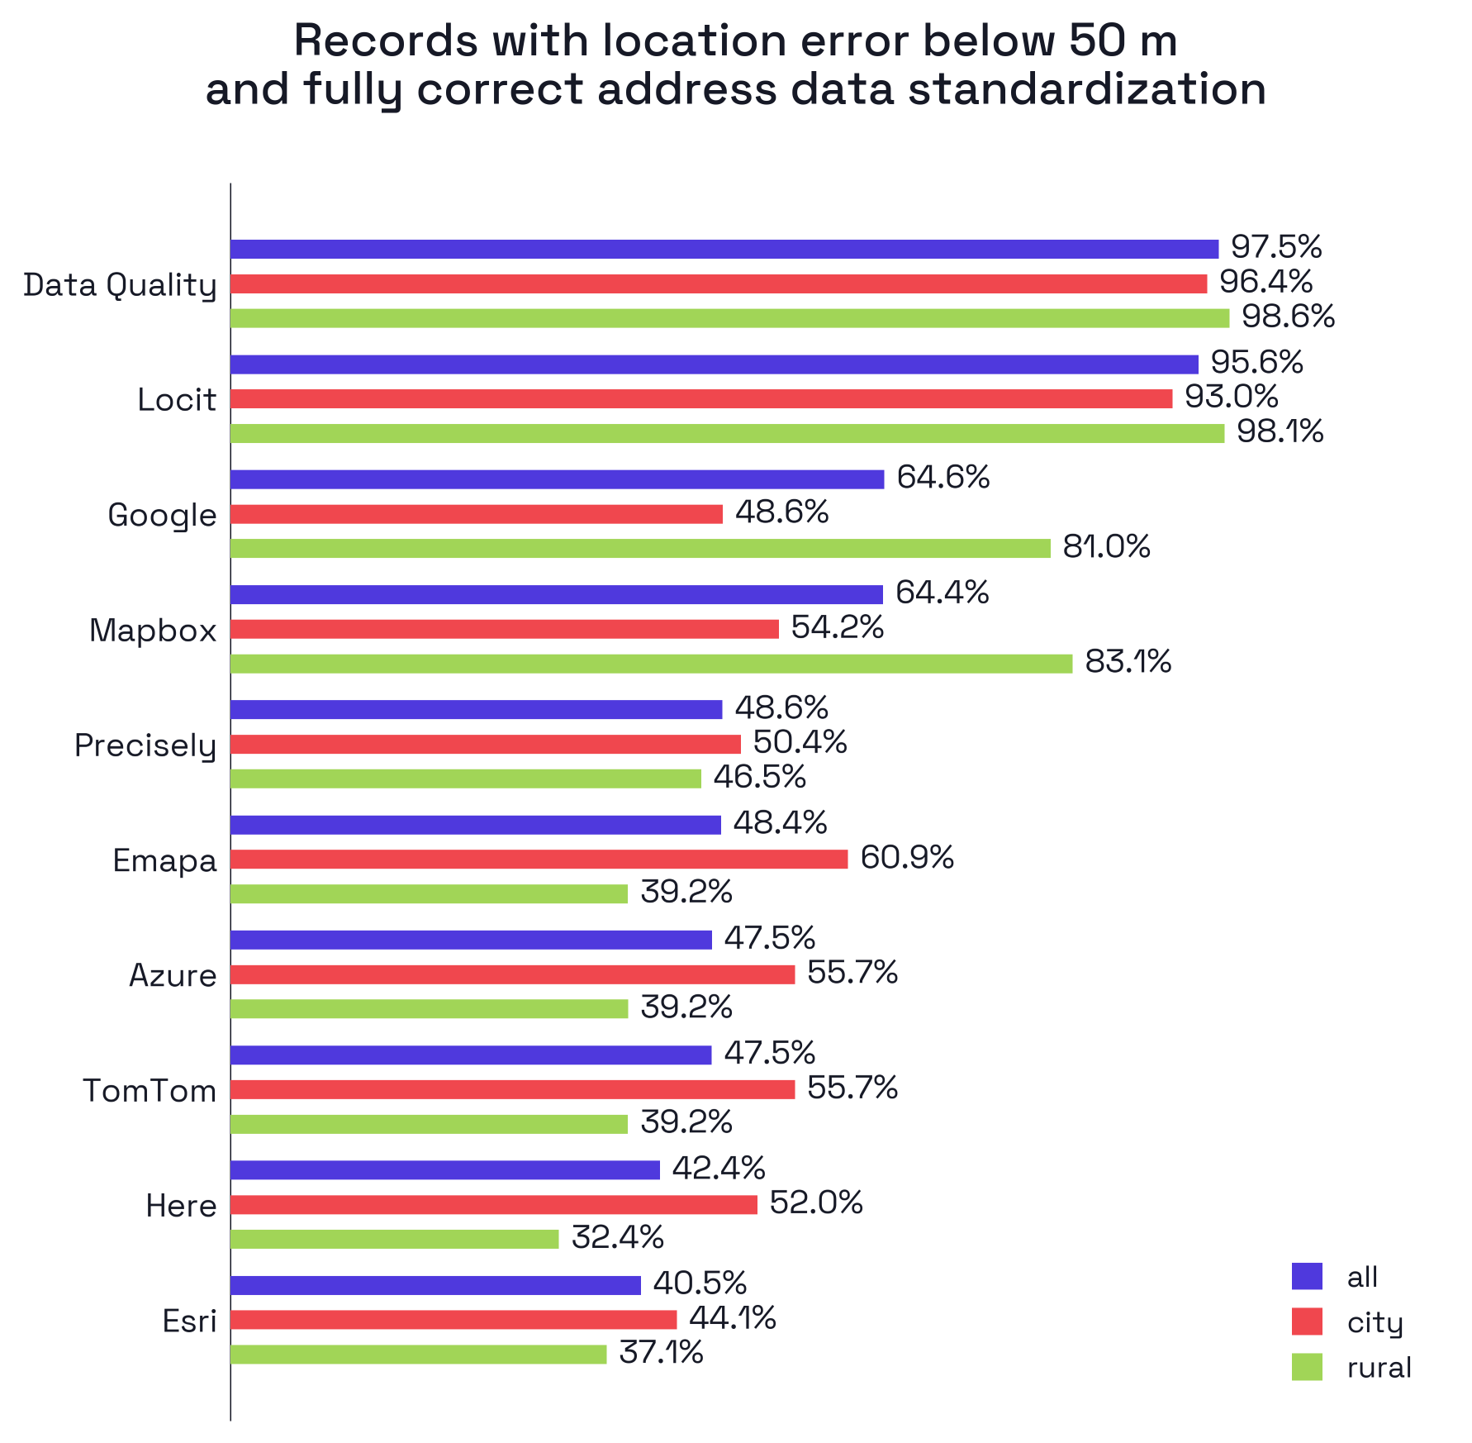
Percentage of records with an error below 50 m and fully correct standardization of the address data - the higher the value, the greater the address–point consistency (maximum = 100%).
Urban vs. rural
The same regularity recurs on both dimensions: services do markedly worse on rural addresses than in cities - both in standardization (no division into streets, greater variability in how addresses are written) and in geocoding (a heavier error tail). A tool that “looks good” on average can therefore generate a disproportionate number of exceptions in processes with nationwide reach. That is why we computed every metric separately for urban and rural areas.
How does this analysis translate into costs?
Quality differences translate directly into costs - regardless of the price of the API itself. In a simulation for 100,000 shipments a year, the additional costs (exception handling, incorrect routing, falsely confident errors) range from about PLN 101,000 for the best service to about PLN 897,000 for the weakest. That is a difference of nearly PLN 800,000 a year. The takeaway: a service that is cheap to buy can be the most expensive to run, which is why providers are worth comparing on a total-cost-of-ownership (TCO) basis. The report comes with a spreadsheet in which you can run these numbers on your own volume and rates.
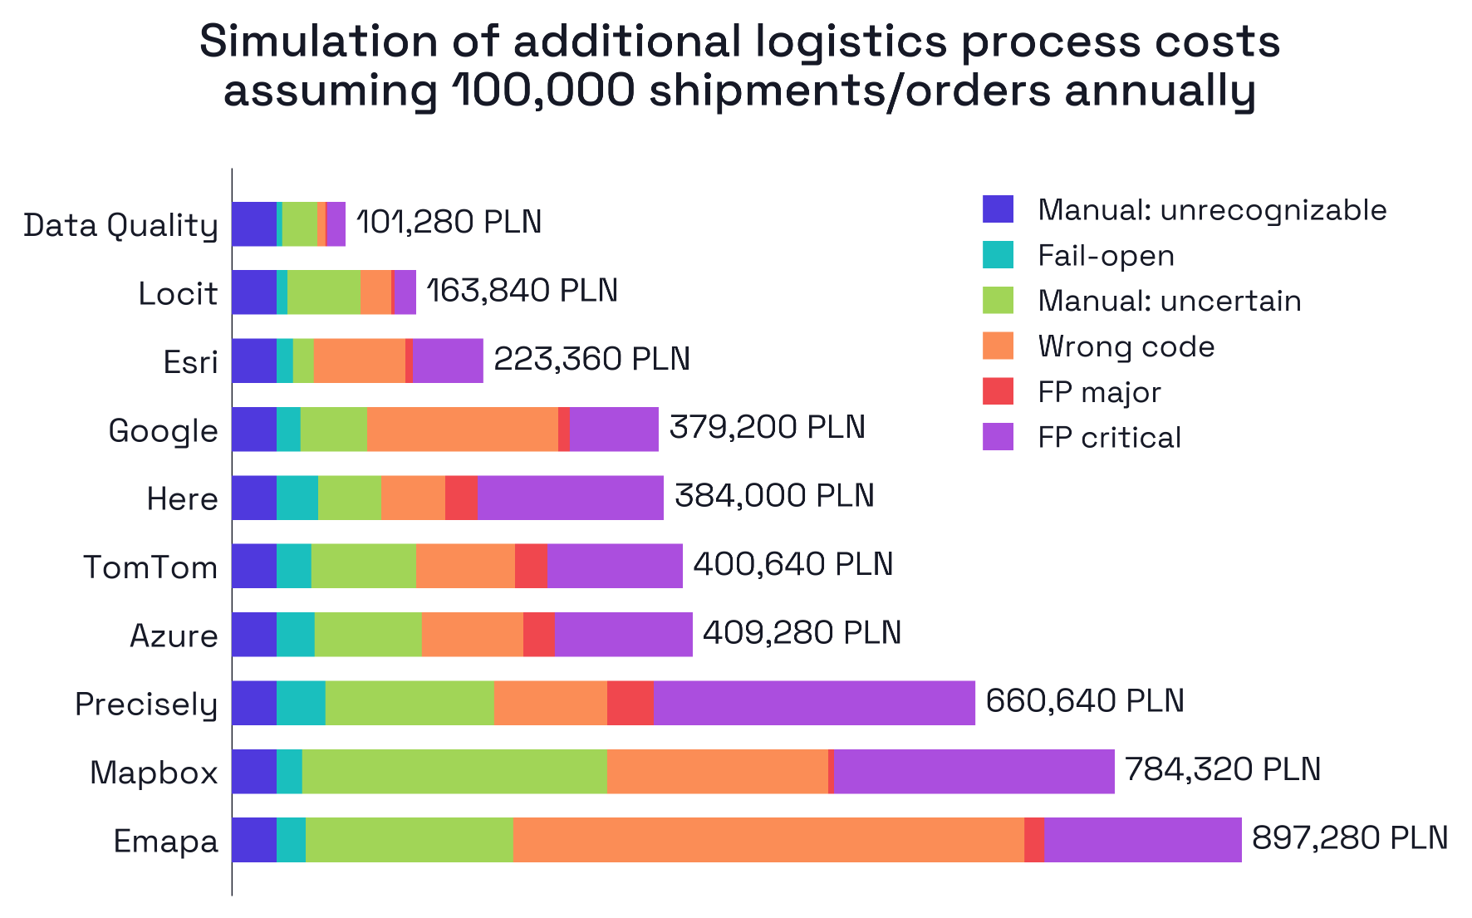
Simulation of the additional cost of running the logistics process, assuming 100,000 shipments / orders per year
What to look for when choosing a service
- Assess both dimensions at once. A good location does not guarantee an address that is usable as a key - and vice versa.
- Look at the error tail, not the average. Costs are driven by rare but large errors - check the 95th percentile and the share of errors above 1 km, not average accuracy alone.
- Insist on consistency with TERYT. Matching names and identifiers to the register gives you a stable key that does not depend on the provider. In our study, only Data Quality and Locit delivered it.
- Analyze urban and rural areas separately. If you operate nationwide, an averaged result can mask a service's weakness on rural addresses.
- Calculate the cost on your own data. Plug your own volume and rates into the attached spreadsheet before you decide - the API price is usually a fraction of the total cost.
Accessing the report
We make the full report, together with the simulation spreadsheet, available free of charge at this address. If you have any questions or would like to discuss the results, we encourage you to get in touch with us.