In this tutorial you will learn how to build a predictive model using AdvancedMiner in a few simple steps. First of all, go to the free AdvancedMiner download page.
How to build a predictive model with AdvancedMiner?
Create an alias – all databases are stored there.

Select the folder where you want to save it.

Import the database from your hard drive.


Examples of using Freq and context scripts
View the data. In this example the Class is the attribute that will be predicted. In addition to displaying the data, you can perform many other operations related to your database, e.g. use the Freq for data analysis. Freq calculates statistics for the analysed variables, which enables to obtain important information about the attributes. It also allows to create visualizations of variable distributions, to build various histograms, and to study the relationship between the variables and the target, or to group the value of a categorical variable. You can read more about Freq functionalities here.
Another interesting feature is context scripts that allow you to divide and sort tables. Context scripts also have more applications, but if you need even more advanced functions you can create and add your own scripts to your liking.

Gython Script – creating Python scripts
In order to predict success or failure easily, you can change target into a numeric value by simply modifying the database. Right-click on the project, select „New” and then „Gython Script”.

Gython Script allows you to create scripts in Gython, which is the language used for Python-based data processing. Numerous operations and modifications on the databases enable the use of SQL queries in Gython, which is possible after entering „sql:” or „sql in `alias_name`”.
In this language, the ability to combine Python and SQL commands is highly relevant, therefore it is possible to use different functionalities of both languages at the same time (e.g. loop SQL commands). In this example, we will use SQL to make changes.

A column with values of „1” and „0” was created. This is our new target.

Creating Workflow
Next, create a new Workflow.


Using drag&drop method to place your database in the middle of the Workflow. Repeat the process with the Split Table. To connect them, drag the anchor from your database into the Split Table anchor.
Although Workflow is easy to use, it allows to perform more complex operations such as creating diagrams, technical and analytical transformations, modeling, generating code or adding your code written in Gython Script.


To select attributes, use the Attribute Usage tile.

Edit the tile and select which attribute is the target.

Set unnecessary attributes as inactive.

Press the Execute button or F6.

Application of the tree method
Use the tree method to create a model. Connect it to Attribute Usage and the database. Set the positive value of the target to „1” (or „0”, depending on what you want to predict) in the algorithm settings.
In addition to the tree method, there are also methods such as linear and logistic regression. Each method contains a number of unique settings, which can be freely customized.


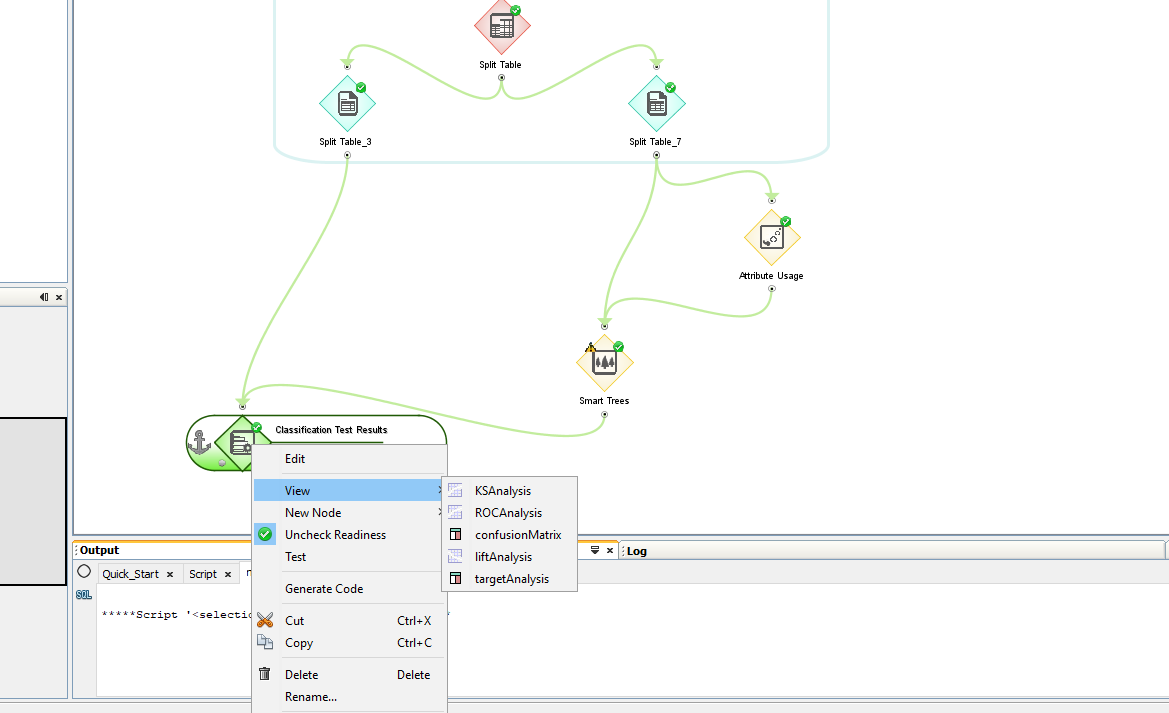
To see how effective your prediction is, select Classification Test Result and connect it to the test database and model. Edit and select the target and its positive value.


The Classification Test Result allows you to analyze the results. We can see how the ROC curve looks, and calculate the area under the curve, see the Lift curve, or interpret the confusion matrix.
To predict the results using your model, attach to Workflow the database which you want to predict. Next, attach the Scoring tile, which must be connected to the model.

Select 'View Mining Apply Task’, then add the item in 'New Columns’.


Follow the steps below:


Press the Execute button or F6.

A column with the probability that the value „1” will appear was added.

Select the minimum probability from which the value will be positive.

And check for which items there is a „1” and for which there is a „0”.