
Modern Machine Learning scoring engines rely on increasingly complex data flows: feature transformations, predictive models, business rules and database queries all interacting within one scenario. When something goes wrong, identifying the exact point of failure can take hours - or even days.
To solve this, we’re introducing the Debugger, a new module in Scoring.One designed to radically simplify ML pipeline debugging, enhance model interpretability, and give full transparency into every step of a scoring scenario.
This is the most impactful enhancement we’ve made to Scoring.One in terms of observability, traceability and debugging efficiency.
Why Debugging ML Scoring Pipelines Needed a Better Tool
Data Scientists and Machine Learning Engineers working with Scoring.One often build scenarios that combine:
- predictive models,
- transformation nodes and feature engineering,
- decision logic and rule evaluation,
- internal and external database queries,
- chained sub‑scenarios and complex branching.
In such environments, traditional validation is not enough. Teams need the ability to:
- analyze data flow across nodes,
- track variable evolution step by step,
- diagnose logic errors in real time,
- understand why a model produced a given score,
- test scenarios using custom input datasets and edge cases.
Until now, this level of insight was not possible directly in Scoring.One. Debugger changes that completely by introducing a transparent and interactive execution‑tracing mechanism.
How the Debugger Provides Full Transparency Into Scenario Execution
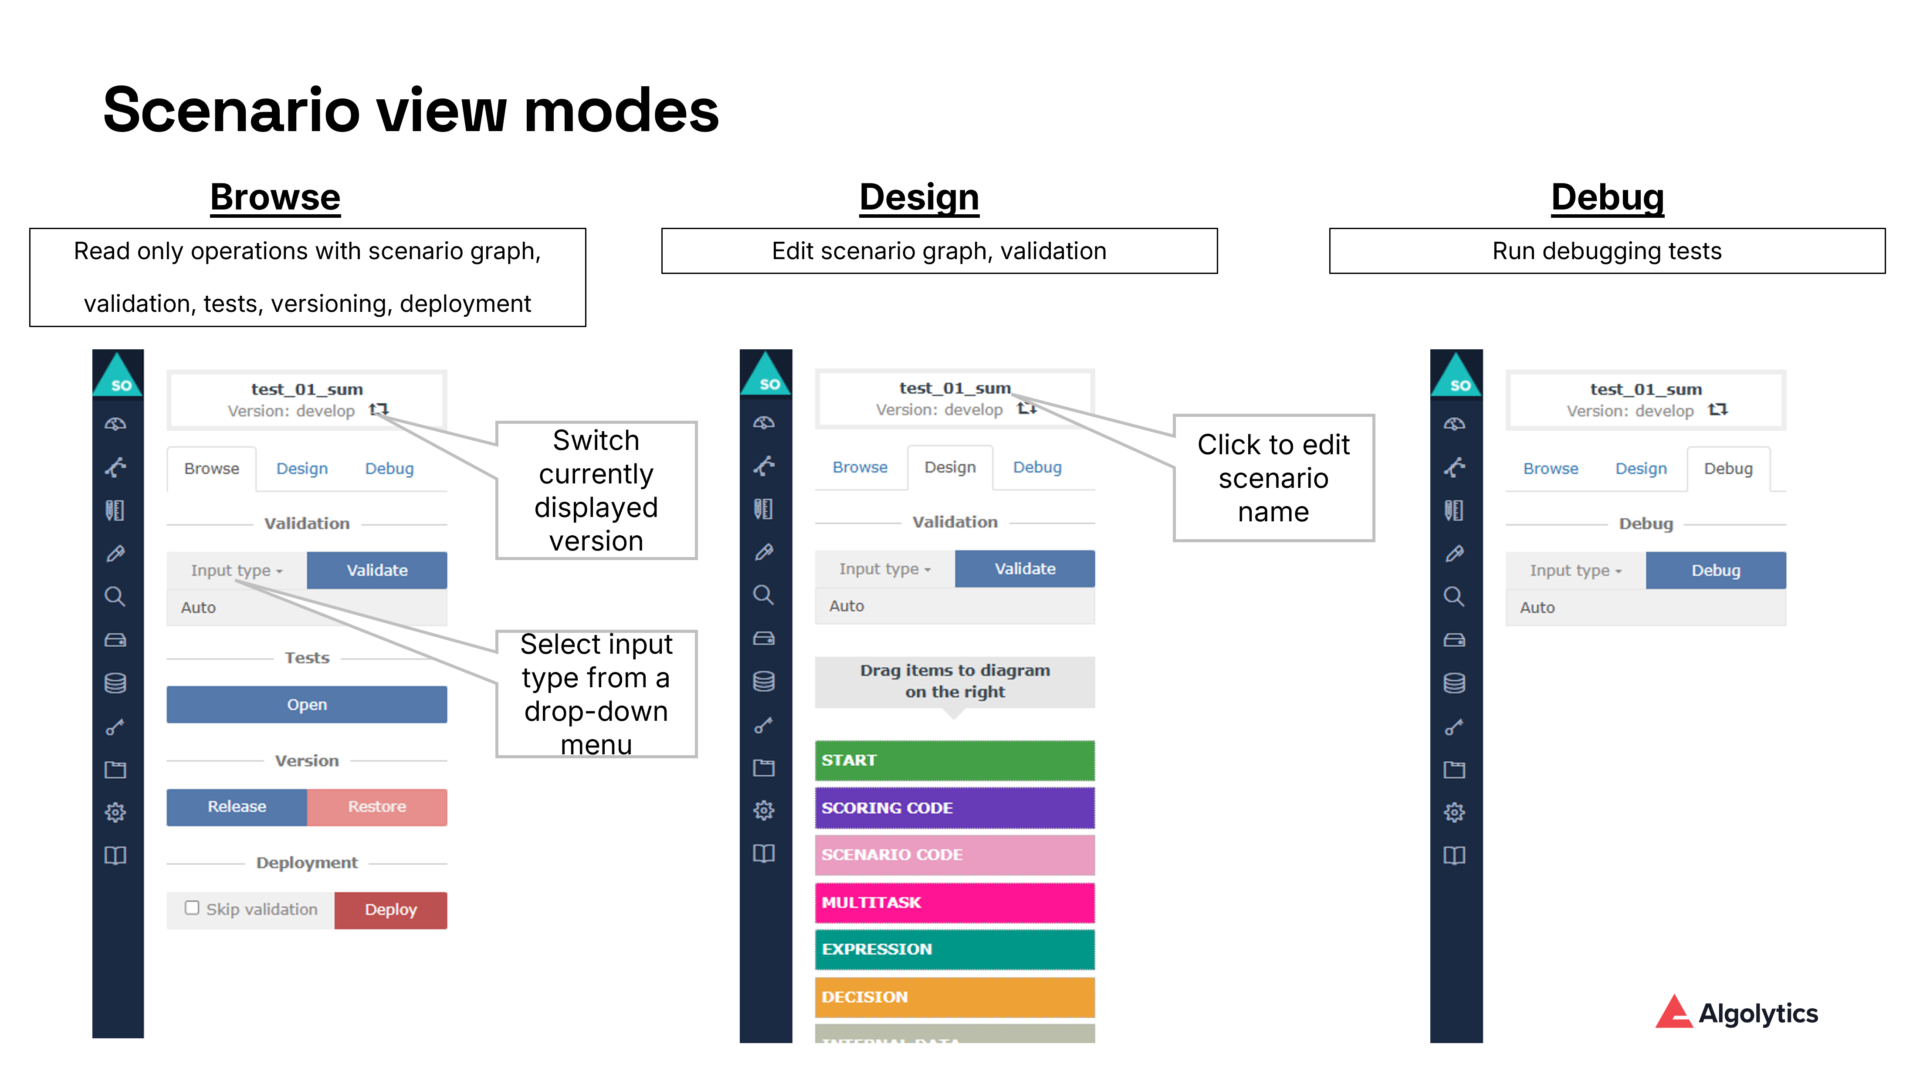
Debugger appears as a new mode in the scenario editor, alongside Browse and Design. Once activated, it allows users to:
- run scenarios with fully controlled input data,
- visualize execution paths within the scenario graph,
- inspect variable values after each executed node,
- monitor timestamps and detailed execution metadata,
- filter large datasets using built‑in tools.
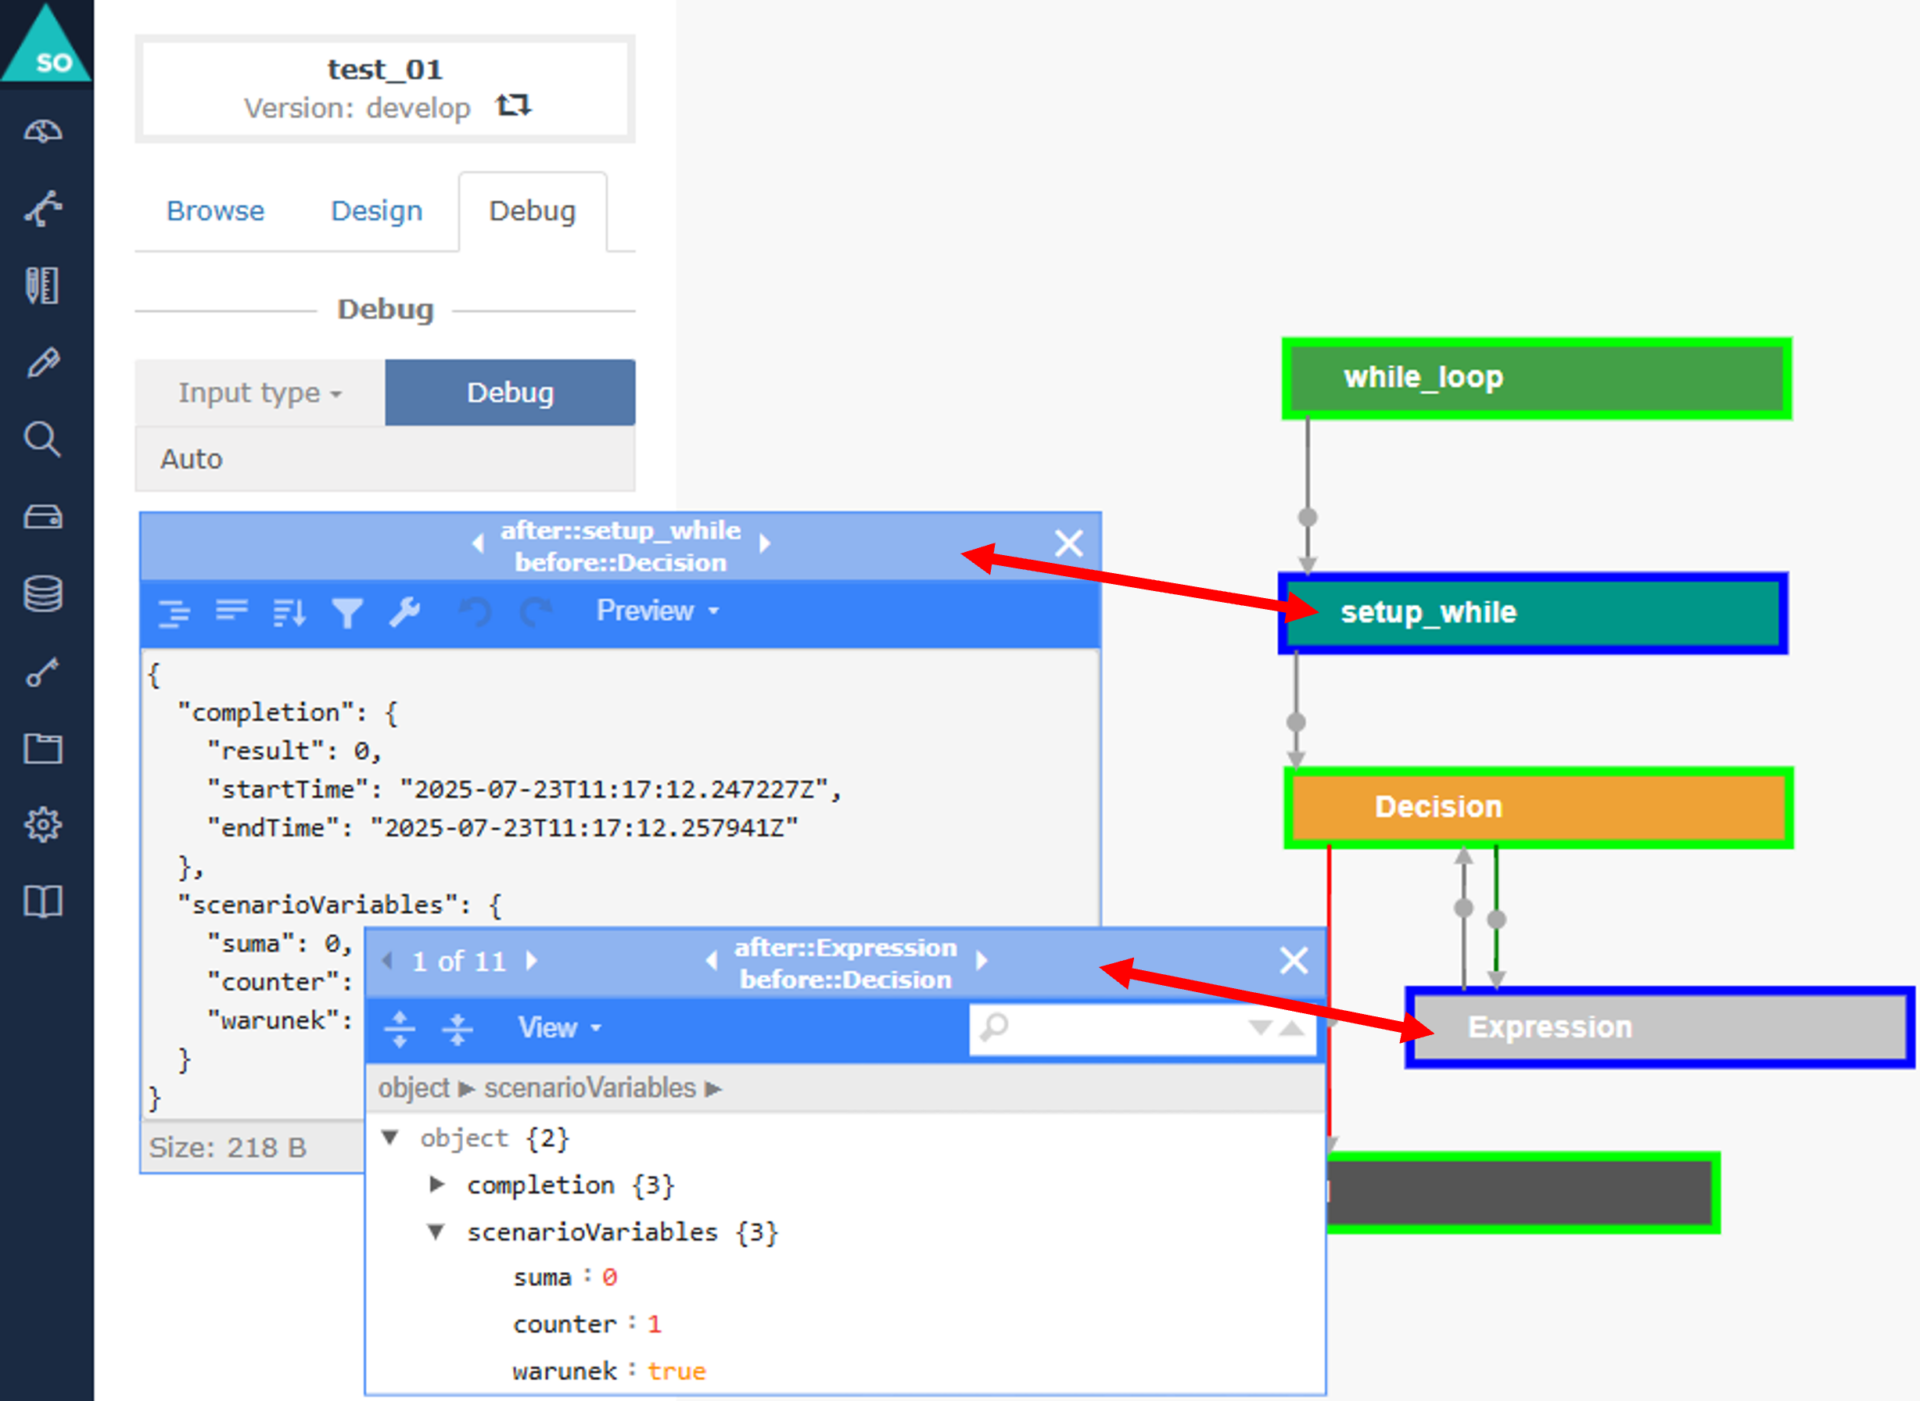
As the documentation specifies, each executed node becomes marked with a light green edge, providing an instant visual guide to the logic path taken by the scenario.
- Auto – default system‑generated values,
- Form – manually entered values,
- Inline – JSON‑based input for advanced testing.
This makes debugging accessible both for analysts and technical teams.
Node‑Level Variable Inspection for Advanced Model Interpretability
A key capability of the Debugger is the ability to inspect all variable values at the end of each node’s execution.
By clicking a node, users gain access to a dedicated floating window that includes:
- start and end timestamps,
- output variables generated by the node,
- model predictions and transformed feature values,
- formatting options and filtering capabilities for large outputs.
This node‑level introspection dramatically improves:
- interpretability of ML models,
- quality assurance of feature engineering,
- troubleshooting of unexpected model scores,
- understanding branching logic and decision outcomes.
It brings to scenario debugging what IDEs bring to software debugging - but tailored to ML scoring processes.
Using JSON Inputs for Precise Reproduction of Edge Cases
To support rigorous testing, Debugger accepts JSON‑formatted inputs, allowing Data Scientists to recreate:
- boundary values,
- missing or abnormal data patterns,
- outlier scenarios,
- rare business conditions,
- specific customer profiles.
Example JSON input for Inline mode:
JSON
{
"age": 46,
"income": 12700,
"credit_history_length": 8,
"active_loans": 2
}
With this, teams can precisely reproduce problematic or atypical cases and analyze how every part of the scoring pipeline behaves.
How Debugger Accelerates ML Model Diagnostics and Scenario QA
Debugger delivers several high‑impact advantages for Data Science operations:
✔ Faster debugging of ML scoring logic
Issues can be identified by visually following the executed nodes and reviewing variable values at each step.
✔ Improved model interpretability and transparency
Teams can validate how predictions are formed and how they propagate through business rules and transformations.
✔ Higher confidence in production‑ready scenarios
Testing various input types ensures robustness across real‑world distributions.
✔ Reduced back‑and‑forth between Data Science and engineering teams
Debugger serves as a shared source of truth for the scenario’s behavior.
✔ Shorter time‑to‑production for ML models
Less time spent diagnosing errors means faster deployment cycles.
Why Debugger Elevates Scoring.One as a Scoring Engine for ML‑Driven Organizations
The introduction of the Debugger turns Scoring.One into an observability‑first platform for ML pipelines. With complete transparency into every node, variable and decision:
- scenario development becomes more predictable,
- model debugging becomes dramatically faster,
- data quality issues are easier to detect,
- integration errors can be identified early,
- scenario logic becomes easier to communicate and document.
This is a game‑changer for organizations using Scoring.One as a central scoring engine for risk assessment, fraud detection, credit scoring and other ML‑driven processes.
Debugger: Enabling Transparent, Explainable and Reliable ML Scoring Pipelines
Debugger transforms scenario development and monitoring by enabling:
- step‑by‑step execution tracing,
- deep variable inspection,
- interactive visual debugging,
- flexible input testing,
- faster QA and deployment workflows.
By giving Data Scientists complete visibility into scenario logic and model behavior, Debugger sets a new standard for transparent and reliable scoring pipeline development.