SOM Explorer is a visualization tool designed to support the analysis using Self Organizing Maps (SOM) models. These include clustering and classification models built with the Kohonen algorithm.
For a quick start see the SOM Explorer Data Sources section.
The main capabilities of SOM Explorer include:
the visualization of a SOM model in the form of maps of attributes,
two levels of segmentation,
the possibility of automatic or manual 2nd level segment modification (enables the incorporation of knowledge from external sources into the model),
the possibility of viewing attribute statistics like mean, standard deviation, maximum, minimum of the segment (also over various data sets),
aggregation of statistics over the 2nd level segments.
Note
Understanding of the Kohonen algorithm and the SOM model representation can be helpful in understanding the SOM Explorer tool.

In this section the SOM model representation is described and the details of how this representation can be visualized using the SOM Explorer tool are discussed.
The SOM model consists of two-dimensional maps of neurons. Each neuron is embedded in two topological structures: one connected with its position on the map and the other with its position in the space of the learning data.
The position on the map is specified by a two dimensional integer vector. The location of a neuron on the map is used to define its neighborhood.
In the space of the learning data each neuron is represented by a real vector. Each element of this vector represents the dimension of one of the input attributes (see also signature attributes) and in the context of SOM Explorer is called a component. As it represents the dimension of an attribute it can be identified by its name.
One of the most important features of the SOM model representation is the correspondence between the local topological properties of the high-dimensional learning data space and the two-dimensional map: neurons close to each other on the map are also close in the learning data space.
In SOM Explorer neurons are displayed on the maps as hexagonal cells. Each inner cell has six adjacent neighbors.
As the number of cells can be high, it is necessary to group cells into assembles. Such assembles are called segments. The main goals of introducing segments are:
replacing a large number of cells with a lower number of segments
easier interpretation of segments since they are highly aggregated
ease of manipulation, as cells can be easily moved from one segment to another.
Segments in SOM Explorer are identified by their name. They can be created manually (see the Moving cells among segments section) or automatically with the Ward algorithm (see the Automatic Clustering section) .
In general, SOM Explorer shows two variants of model information. The first one is related to the model itself and the second to the statistics gathered for the data (e.g. the information related to the model can be a component value in the cell). In both cases SOM Explorer is used to display these statistics. To activate SOM Explorer find a SOM model in the repository and double click on ModelStatistics.
The second variant relates to the statistics gathered for the data and not the model itself. This can be for example the average attribute value of a cell. This value should be close to the value of the related component if the quality of the model is good. Such information can be calculated by executing ComputeModelStatisticsTask that computes ModelStatistics instance for some data. This can be learning data but even more interestingly some validation or production data. It is also important to note that an attribute for which the statistics are computed does not have to be used for model building.
In AdvancedMiner one SOM Explorer instance is capable of working with more than one ModelStatistics object. This object is called a segmentation in the context of SOM Explorer and should be dragged and dropped to the SOM Explorer application before it can be accessed from within it.
One map (see the figure A Single Map) displays the statistics of one SOM model instance. These statistics can be computed for single cells (neurons) or whole segments (groups of cells). In the case of segments the statistics are obtained by aggregating the values for constituent cells.

In SOM Explorer the statistics shown on the map represent continuous values or the assignments of cells to segments, which is a categorical value.
Continuous values are derived from the information connected with attributes. In this case a whole set of statistics is available, computed either for cells or segments, depending on the chosen aggregation option:
the component related to the attribute
avg – the average value of the attribute
var – the variance of the attribute
stdDev – the standard deviation of the attribute
min, max – the minimum and maximum values of the attribute
missing – the number of objects (data instances) that have missing value for this attribute
avgSquare – the average of the squared values of the attribute.
All statistics besides the component are gathered for the data and are computed for the population assigned to the cell or the segment by the model. The component of the model is connected to the model itself and gives the value of the related neuron coordinate in the data space as mentioned above.
Note
The value of the component can also be aggregated over a segment. In this case a weighted average over the cells constituting the segment is computed with the weights equal to the number of objects in individual cells.
Some statistic can be based on the cells separately and not on the attribute. This is the case with:
object count – the number of all object assigned to the cell or the segment
missing - the number of missing values of attributes for the assigned objects.
The last kind of information that can be shown on the map is the segment assignment of the cells. This value, unlike the previous ones, is a categorical quantity.
All settings that are required to construct maps are gathered in the 'New Maps Wizard' (see the New Map Wizard figure).

A single map displays the values of one statistic for cells or segments (depending on whether the aggregate option is enabled). Besides that the segments can be shown. There are three possibilities:
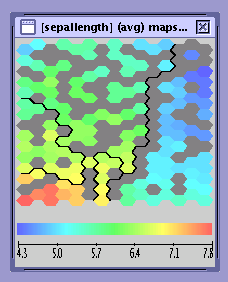
only a continuous statistic is shown (see the A Single Map figure)
only the segment assignment of cells is shown (see the Segments Map figure)
both a continuous statistic and the segment assignment are shown (see the Combined Map figure).


The choice described above can be made during map creation in the bottom section of the map creation wizard .
The bold lines on the map indicate segments boundaries.
Missing values are displayed in grey, as shown on the figure below. In this case the missing values are a consequence of small object count. It is not possible to compute statistics for cells to which not enough objects have been assigned (see also the SOM Explorer Data Sources section).
It is necessary to select cells in order to:
locate the cells representing the same neuron on different maps
move the selected cells from one segment to another.
Cells are selected by clicking the left mouse button on them. (The button can be held down for faster selection). Cells are removed from the selection by shift-clicking the left mouse button. The above actions can be applied to whole segments by simulatneously holding down the control key on the keyboard.
To move cells to another segment one has to:
select the cells to be moved
right-click on the selection and choose the 'move to' option, which displays the possible destination segments.
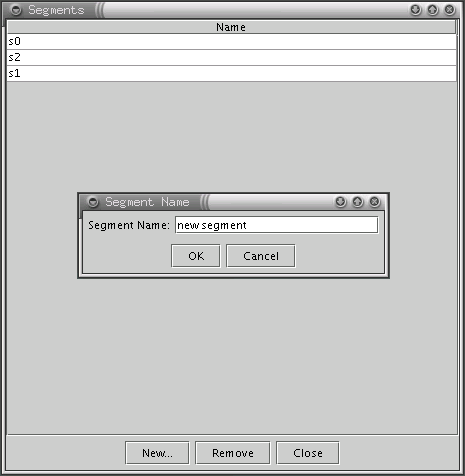
To add or remove segments see the Adding and Removing Segments section.
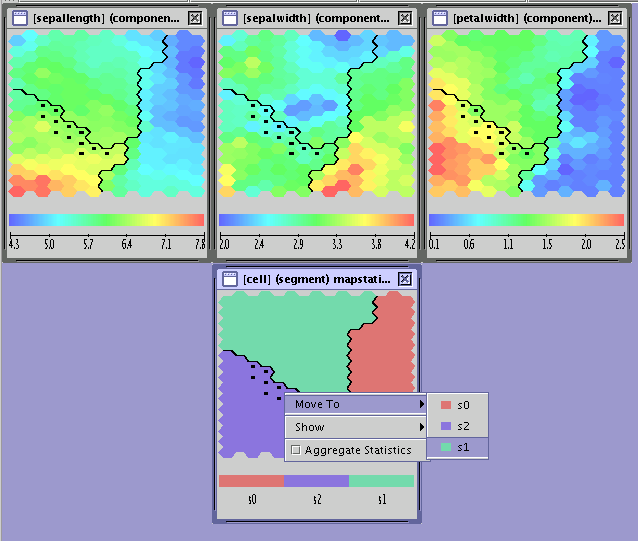
The single map view has a number of options. The most important one is the statistic aggregation. It is enabled by right-clicking on the map and choosing the 'Aggregate Statistics' option.
Other options enable and disable tool tips and segment names. These options are also available by right-clicking on the map.
As mentioned above, cells can be grouped into segments manually or using the Ward clustering algorithm (see the Automatic Clustering section). In both cases it may be necessary to add or remove some segments manually. This can be done by using the panel activated with the Segments button in the SOM Explorer main toolbar.
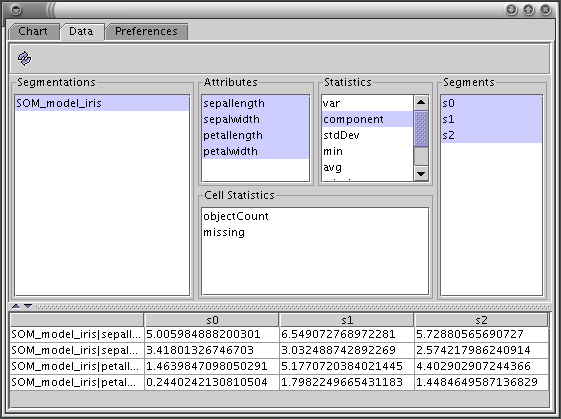
The statistics for segments can be viewed on 3D bar charts using the Chart Tool. The Chart Tool contains three tabs: Chart, Data and Preferences.
This tab is used for selecting segments and statistics to be shown on the chart. In the bottom section of the tab there is a table with the values of the selected statistics. To show these values click the 'Refresh' button.
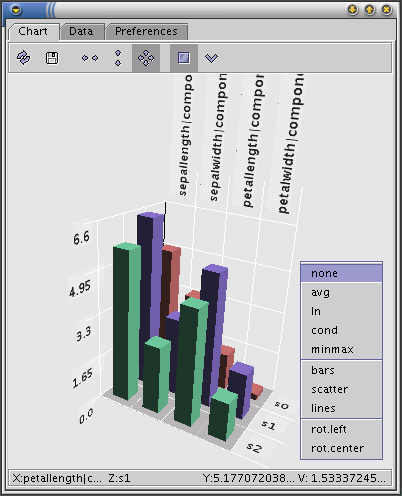
The 3D bar chart for the selected statistics is shown in this tab. On the X-axis are the names of the statistics, on the Z-axis the names of the segments and on Y-axis the values of the statistics for each segment.
The chart can be manipulated using the mouse:
to rotate press and hold the left mouse button and move the mouse. The chart will rotate in the direction of the movement;
to zoom press and hold the middle mouse button and move the mouse up to zoom out or down to zoom in;
to move the chart press and hold the right mouse button and move the mouse in the desired direction;
to select a statistic click the left mouse button on the bar representing the statistic; this statistic will then be shown in the status bar;
Clicking the right mouse button triggers the context menu with three groups of options:
normalization which can be applied to the values of the statistics; v is the value of the given statistic for the given segment, avg/min/max is the average/minimum/maximum value of the given statistic over all segments
none: v;
avg: v / avg*100;
ln: ln( v / avg*100 );
cond: if( v > avg ) then ( v / avg ) else ( avg / v );
minmax: if( min = max ) then 0 else ( v – avg )/( max – min );
the type of display;
the center of rotation (the point around which the chart is rotated): left is the point (0,0,0) on the axes of the chart, center is the geometric center of the chart;
Other options are available from the tool bar:
Refresh – refreshes the chart display when the data definition changes;
Save – saves the chart image to a file;
Block rotation to vertical, horizontal or free rotation;
Unlock Plane: a special plane can be used to compare the heights of different bars. Just grab it and drag it along the Y axis (initially it is XZ plane with Y = 0 i.e. the bottom of the chart)
Legend – shows/hides the legend with the segmentation and color assignments.
This tab is used for selecting how the statistics are labeled on the chart. The label for each statistic has three parts: the name of statistic, the name of the attribute and the name of the segmentation. A full label precisely identifies the given statistic but in many cases it only clutters the display, so it is possible to use shorter labels.

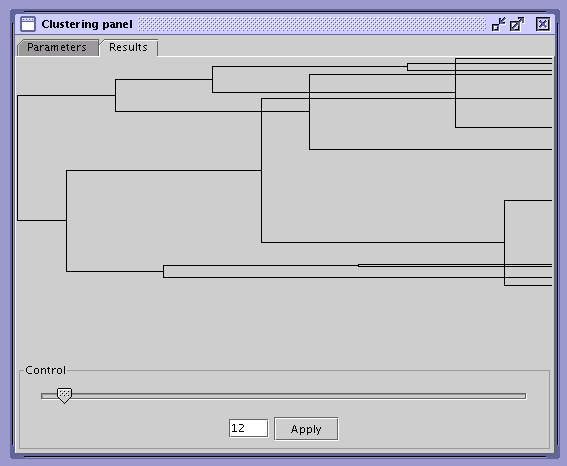
SOM Explorer is equipped with an automatic clustering tool. Its interface consists of two tabs: Parameters and Results. In the Parameters tab the user can modify the behavior of the clustering algorithm and provide the statistics which will be used for the creation of clusters. To start the clustering process press the Start button. A branching diagram representing the history of cluster merging will appear in the results tab. To apply results, select number of clusters and press the Apply button.
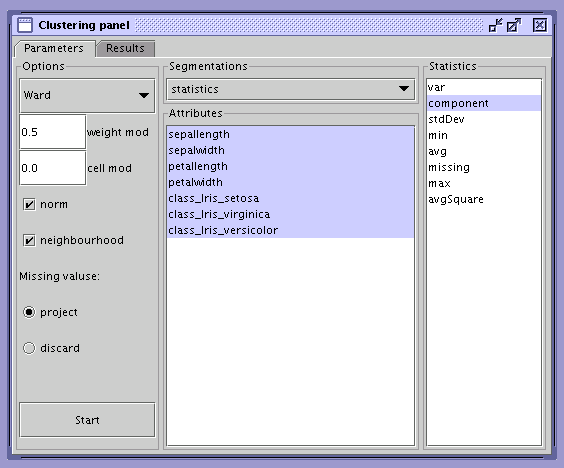
The following options are available in the Parameters tab:
the distance metric between two clusters:
Ward – the Ward distance;
Min – the minimum distance between arbitrary cells from different clusters;
Max – the maximum distance between arbitrary cells from different clusters;
Avg – the average distance between cells;
the modifiers for the distance metric forcing the desired behavior of the algorithm:
weight mod – increasing this modifier increases the preference for merges that cause even distribution of observations between clusters;
cell mod – increasing this modifier increases the preference for merges that cause even distribution of cells among clusters;
norm – if true, values for cells will be normalized;
neighborhood – if true, only adjacent clusters will be considered for merging;
treatment of missing values:
project – use only the dimensions which are not missing;
discard – discard missing values.
Working with a large number of maps is supported with window management functions. They can be activated by clicking the right mouse button on the main SOM Explorer panel (see the figure below).

The following options are available:
Window arrangement options like tile and cascade
Operations on the active window, visible windows and all windows - restoring their default size, minimizing, maximizing, and closing.
Defining window order used during arrangement:
Null – windows are arranged in the order they were created
Names – windows are arranged by names
Description – windows are arranged by description.
A list of all windows activated with the Show List option can be used to quickly locate maps and set their descriptions.

In addition, there is a movable window list bar (on the top of the display by default) that can also be used to locate windows.
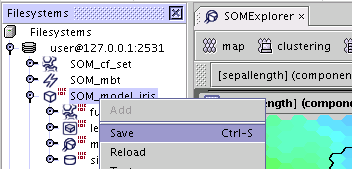
After modifying (for example removing cells or moving them to other segments) the model can be saved to the metadata repository using the general AdvancedMiner procedure (for example by pressing Ctr+S). If the model is modified it is labeled with a small red icon (see the figure below).