All capabilities of a chart are accessible after creating the chart object. A chart is created by specifiying the appropriate type (i.e. ScatterPlot, LinePlot, etc). The information about the data is passed as an argument to the object constructor. See more information about chart types.
A chart object is created by the constructor of the chart of the selected type class. The constructor syntax is as follows:
PlotType(dataObject)
where PlotType should ne substituted for the name of the appropriate plot class. The dataObject parameter specifies the data object which should be used for creating the plot.
For each chart object the following methods are available:
Table 11.1. Methods for Chart objects
| method name and syntax | description |
|---|---|
show() | creates the chart window for previously specified data |
setTitle(name) | sets the chart window title |
getTitle() | returns the chart window title |
getJFreeChart() | returns the associated object of the org.jfree.chart.plot.Plot class, which can be used for extended edition of chart properties. See the Plot class documentation for details. |
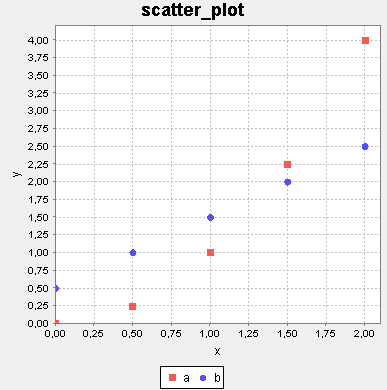
Example 11.7. Preparing data and displaying a scatter plot
d = Data('tableName', ['x', 'y'] )
ScatterPlot(d).show()
The data object d can also be used to create other charts.
There is also a simpler way of creating charts ad-hoc. It is particulary convenient for creating a single chart, without creating a Data object.
The three main chart types are described below.
The syntax for the Data constructor for use with 2D charts is the following:
Data(tableName, [x_column, y_column])
or
Data(tableName, [series_column_name, x_column, y_column])
Table 11.2. Description of Data constructor parameters for 2D charts
| Parameter | Description |
|---|---|
| series_name_column | the name of the containing the names of series to which the the coordinate pairs belong |
| x_column | the name of the column with the x coordinate values |
| y_column | the name of the column with the y coordinate values |
The syntax for the Data constructor for use with 3D charts is the following:
Data(tableName, [x_column, y_column, z_column])
or
Data(tableName, [series_column_name, x_column, y_column, z_column])
Table 11.3. Description of Data constructor parameters for 3D charts
| Parameter | Description |
|---|---|
| series_name_column | the name of the containing the names of series to which the the coordinate pairs belong |
| x_column | the name of the column with the x coordinate values |
| y_column | the name of the column with the y coordinate values |
| z_column | the name of the column with the z coordinate values |

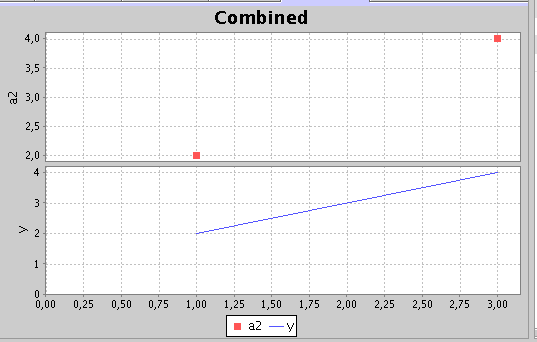
It is possible to plot more than one chart on the same display with common x and y axes. The range of common axes will be set to show all the values from the grouped charts.
It is possible to group horizontally (common x axis) as well as vertically (common y axis)
Syntax:
CombinedVerticalXYPlot(xyplot1, xyplot2, ..., xyplotN)
CombinedHorizontalXYPlot(xyplot1, xyplot2, ..., xyplotN)
This subsection describes some useful capabilities of the JFreeChart interface.
The JFreeChart class provides a mechanism for using logarithmic axes. The library provides the BetterLogarithmic implementation via the BetterLogarithmicAxis function.
Example 11.13. Creating a plot with a logarithmic axis
table 'table_1':
    a1  a2
    1   2
    3   4

chartObject = ScatterPlot('table_1', ['a1', 'a2'])
chartObject.getJFreeChart().getPlot().setDomainAxis(BetterLogarithmicAxis('axis_name'))
chartObject.show()
Warning
Logarithmic axes require positive data values.
Below is an example of how to add a vertical marker labeled 'marker_label'
                        table 'table':
                        a1  a2
                        1   2
                        3 4
chartObject = ScatterPlot('table', ['a1', 'a2'])
plot = chartObject.getJFreeChart().getPlot()
m = org.jfree.chart.plot.ValueMarker(2)
m.label = 'marker_label'
plot.addDomainMarker(m)
chartObject.show()
See also: org.jfree.chart.demo.MarkerDemo1.java