The Logistic Regression Module is a tool for constructing binary
logistic regression models. The independent or predictor variables in
logistic regression can take any form. That is, logistic regression makes
no assumptions about the distribution of the independent variables. They
do not have to be normally distributed, linearly related or of equal
variance within each group. The relationship between the dependent and
explanatory variables is not a linear function in logistic regression.
Instead, a logistic regression function is used, which estimates the
(conditional) probability of the occurrence of a certain event. The model
assumes that if  is the estimated probability and
 is the vector of
observations, then
is the vector of
observations, then  may be calculated according to the
formula
may be calculated according to the
formula

where the coefficients  are the
parameters of the model.
are the
parameters of the model.
Let  be a binary target variable, i.e. a variable
which is assigned the value 1 if the event of interest has occurred and
the value 0 otherwise. For an observation
be a binary target variable, i.e. a variable
which is assigned the value 1 if the event of interest has occurred and
the value 0 otherwise. For an observation  the logistic
regression equation is defined as
the logistic
regression equation is defined as

An
alternative (and sometimes more convenient) form of the logistic
regression equation is the so called logit function, defined as


The advantages of the logit models are:
simple transformation of the probability P(y|x)
a linear relationships between the independent variables
continuity
known binomial distribution (
 between 0 and 1)
direct relation to the notion of odds.
Odds is the probability of an event
occurring divided by the probability of the event not occurring:
 . Odds ratio is the ratio of odds for
two different groups. If we have a model for
. Odds ratio is the ratio of odds for
two different groups. If we have a model for  just as above, then
  . So
. So  represents the odds ratio associated
with a 1 unit increase in
represents the odds ratio associated
with a 1 unit increase in  and
and  is the odds ratio for a k unit
increase in
is the odds ratio for a k unit
increase in  .
.
The parameters of the model are given as a vector of coefficients
 .
.
The Logistic Regression Module provides a model for estimating the
coefficients  .
.
The method used for estimating the coefficients  is based on the
maximization of the likelihood function. Having N observations
is based on the
maximization of the likelihood function. Having N observations
 N estimated
probabilities
N estimated
probabilities  and N binary target variables
 the likelihood function is
calculated using the formula
the likelihood function is
calculated using the formula

The likelihood function is a nonlinear function of the coefficients
 and its maximization uses
nonlinear optimization algorithms (see Likelihood Maximization
Method).
and its maximization uses
nonlinear optimization algorithms (see Likelihood Maximization
Method).
After the parameters of the model have been estimated the Logistic Regression module calculates the measures of the goodness of fit of the obtained model. Among them the Wald and Hosmer-Lemeshow statistics are provided (for details see the Goodness of Fit Statistics table).
The presence of multicollinearity (linear dependency between the independent variables) may result in statistical insignificance of particular independent variables while the overall model may still be significant. Multicollinearity may also result in wrong signs and magnitudes of estimates of regression coefficients. To check for collinearity one may look at the correlations (for continuous and ordinal variables) and associations (for nominal variables) between independent variables. However, it is best to use the multicollinearity diagnostic statistics in the Linear Regression Module (see Variance Inflation Factor (VIF) and Multicollinearity). For nominal independent variables it is necessary to create dummy variables for each category except one, which will be considered as a reference category. The dependent variable from logistic regression analysis or any other variable that is not one of the independent variables may be used as the dependent variable in linear regression. Values of VIF exceeding 10 are often considered as indicating multicollinearity, but for logistic regression VIF values above 2.5 may indicate the presence of linearly dependent explanatory variables.
Multicollinear variables may be combined into one variable or redundant multicollinear variables can be dropped from the model.
The 100(1-Confidence Level)% confidence interval for the parameters estimates is calculated for the confidence level specified in the current algorithm settings. The upper and lower bounds are calculated as:
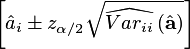
where  is the
  percentile of the standard
normal distribution, and
percentile of the standard
normal distribution, and  are the i-th diagonal elements of the estimator covariance
matrix.
are the i-th diagonal elements of the estimator covariance
matrix.