Freq offers a selection of tools to facilitate the data analysis process:
- virtual attributes, including attribute clones and attributes defined by simple SQL queries,
- SQL-based data filter for restricting the dataset to samples of interest,
- capability to define the target attribute and positive class for categorical and numerical attributes,
- correlation matrix component
There are two types of virtual attributes: clones and SQL attributes. A virtual attribute can be worked on just like a real attribute, but it is not stored physically in the database table.
In a situation when it would be convenient to have two or more copies of an attribute displayed in Freq it is possible to create a clone of an attribute: select the attribute of interest and choose from the context menu.
This creates a virtual attribute (which will not be added to the original database table) with the same name and settings as the original one. It is, however, possible to change the settings of a clone, such as display mode, histogramm or division into levels, independently of the original attribute.
To remove an attribute clone, select it and choose from the context menu. Additionally, clone attributes are automatically removed when the Freq component is closed.
Hint
To create a clone attribute which will be saved when the Freq component is closed. select the attribute, choose from the context menu, enter the name for the clone in the Name field, leaving the definition field as is, and click . Next, calculate the newly created virual attribute. Unlike an ordinary clone attribute, this attribute must have a different name than the original. When an attribute is created in this way, its settings are not copied from the original.SQL attributes are defined using SQL expressions involving other attributes from the table.
To create an SQL attribute select an existing attribute to use as the basis for the new attribute and choose from the context menu. A dialog box will open with fields for entering the name of the virtual attribute and the SQL expression defining it (See the figure below). Enter the appropriate name and definition and click .
A new attribute box will be created with the assigned name. Select it and issue the Execute command to see the histogram and statistics for the newly created virual attribute.
See the section Expressions in GDBase reference manual for information how to construct valid SQL expressions. The expression defining an SQL attribute may also use the functions described in GDBase core functions section of GDBase reference manual, with the exception of aggregate functions. The expression may use any real attribute from the database table for which Freq had been created, but it is not possible to use the names of virtual attributes in the SQL expression.
To modify the definition or name of an SQL attribute, select it and choose . It is also possible to create a clone of an SQL attribute. If the definition of the original attribute is changed, the clone will also reflect the changes.

Unlike clone attributes, the definition of an SQL attribute is saved in the PhysicalData object associated with calculateStatisticsTask represented by a given instance of Freq.
Note
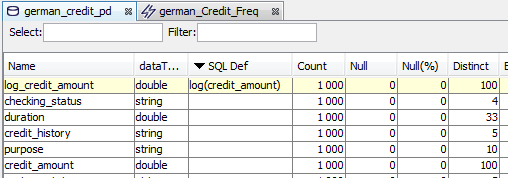
The histogram of an SQL attribute has a yellow background and the table row in PhysicalData view corresponding to an SQL attribute is also yellow.To remove an SQL attribute select it and choose from the context menu. When an SQL attribute is removed, its clones are deleted as well.
Freq has the capability to filter the analyzed dataset according to any criterion that can be expressed as a boolean SQL expression, analogous to a WHERE clause in SQL statements. Additionally, it is possible to compare attribute statistics with different filters applied.
The filtering expression is input in the Where input box in the Freq toolbar. Simple filtering expressions can also be created by selecting levels on the histograms or in the break-down tables of individual attributes.
The WHERE filering expression must return a boolean (i.e. true / false) result. See the section Expressions in GDBase reference manual for information how to construct valid SQL expressions. The expression defining an SQL attribute may also use the functions described in GDBase core functions section of GDBase reference manual, with the exception of aggregate functions. The expression may use any real attribute from the database table for which Freq had been created, but it is not possible to use the names of virtual attributes in the SQL expression.
See also the sections Digging into data and Constructing expressions for information, how to construct simple filtering expressions by selecting levels in attributes.
To apply a filter in the Where input box to data, select the attributes to filter, click the cursor in the Where input box and hit enter. This will result in the recalculation of the selected attributes using only the samples which match the Where expression.
If an attribute is recalculated with a filter applied, the definition of the filter is displayed in the attribute box, to the right of the attribute's name.
To remove a filter delete it from the Where input box, make sure the attributes remain selected, and recalculate them.
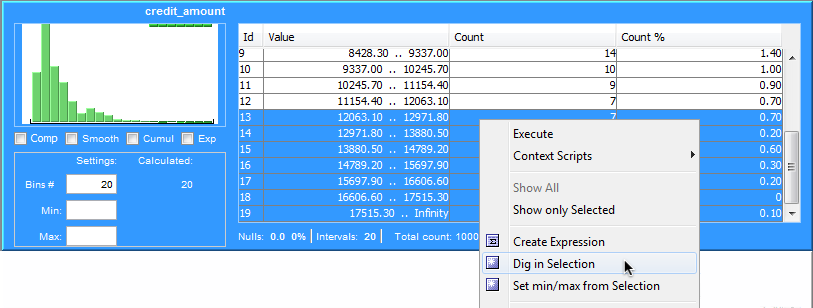
The simplest way to create a filter based on the values of a single attribute is to use the command from the context menu:
- Select the levels of interest on the attribute's histogram or in the break-down table.
- Choose the command from the attribute's context menu.
A filter restricting the dataset to the selected levels will appear in the Where input box and the attribute will be automatically recalculated with the filter applied.
If the attributes is in intervals mode, the filtered attribute will be recalculated with the same number of intervals.
To create an expressions which is a conjunction of expressions selecting levels from more than one attribute follow these steps:
- select the levels of interest in the histogram or the break-down table of the first attribute and select from the attribute's context menu,
- repeat the above step for other attributes, as necessary,
- the resulting expression has been created in the clipboard; paste it into the Where input box
- select the attributes to which to apply the filter and recalculate them.
It is possible to compare the attributes depending on which of the recently filters is applied.

To switch between different filters, pull down the Where input box and select the required filter. Alternatively, use the Ctrl+Left/Right arrow keyboard shortcut to switch between filters.
To preserve the scale of the histograms under different filters tick the Comp check box.
Note
Filters are assigned to attributes: when an attribute is recalculated with conditions specified by a WHERE filter, this filter is saved in this attribute's filter history and can be accessed by pulling down the Where input box. Filter history is preserved when the Freq component is closed.In the Freq component it is possible to define the target attribute and positive category. Both categorical and numerical targets are supported.
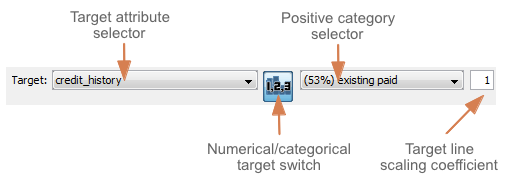
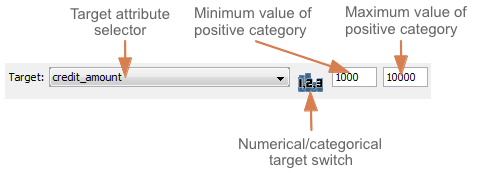
The target attribute is set using the target controls section in the Freq toolbar. Use the numerical/categorical target switch button to switch from categorical target controls to numerical and vice versa. See the figures below for the description of diferent target controls.
To set the target proceed in the following way:
- Select the target attribute from the target attribute pull-down list in the Freq toolbar,
- For categorical target, select the positive category from the positive category pull-down list in the Freq toolbar.
- For numerical target enter the minimum and maximum value of the positive category interval.
- Select the attributes of interest and recalculate them.
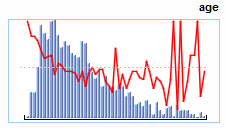
After the attributes are recalculated a red target line will appear on the histograms. This line represents the share of the samples from the positive target category in the level represented by a given bar on the graph.
Additionally, two new columns will appear in the break-down tables:
- Target - the number of occurrences of values from the positive category in the given attribute level.
- Target % - the share of values from the positive category in the given attribute level expressed in percentage points.

Alternatively, it is possible to display Weight of Evidence (WoE for various levels of an attribute and Entropy gain (IV) for categorical attributes instead of the Target % column. This is enabled by setting Weight of Evidence to true in the View subsection of the Freq component's Properties window.
See the Target related statistics subsection below for detailed description of WoE and IV statistics.
The target apriori level for a given attribute is the number of samples from the positive category as compared to the total number of samples in the attribute. When the apriori level is displayed it is possible to compare the overall apriori level with the share of positive category in a given level.
To display the apriori level on the histogram select the from the context menu.
The correlation matrix is an element of CalculateStatisticsTask which contains various statistics related to assessing interdependece between attributes: Pearson's correlation coefficient, correlation ratio and three statistics related to Cramer's V-correlation.
See the Attribute correlation statistics section for the description of various statistics available in the Correlation matrix component.
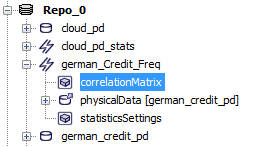
To open the correlation matrix component, select from Freq's context menu or open the correlationMatrix object from the metadata repository.

The correlation matrix is divided into two panels. The left panel displays the correlation table for the selected statistic and the right panel contains the values of the same statistic for all pairs of values, for which the statistic can be calculated.
See the Attribute correlation statistics section for descriptions of different statistics calculated in the correlation matrix component.
To switch between different statistics, select the type of statistic from the context menu.
The and commands in the context menu select whether the variables corresoponding respectively to rows or columns are treated as categorical in the calculation of the correlation ratio statistics.