To calculate an attribute select it and issue the Execute command available in the context menu, in the menu, by pressing F6 on the keyboard, or on the AdvanbcedMiner's main toolbar.
The attributes are not calculated immediately after Freq is launched, because, in the case of large tables, it may take quite long to calculate the statistics for all attributes. Attributes also need to be recalculated whenever a new where filter is defined for the attribute.
After calculation a histogram and values/intervals break-down table are displayed. Each line in the table corresponds to one bar in the histogram.
In the box of a calculated attribute Freq displays a histogram, a levels break-down table and some basic information about attribute values. It is also possible to enlarge the attribute display box, change histogram type or activate comparison mode using the check boxes below the histogram.
The bars on the histogram represent (proprtionally scaled) numbers of attribute samples corresponding to one level: with a specific value (in the case of values mode) or from a specific interval (in the case of intervals mode). One bar on the histogram corresponds to one row in the break-down table, which displays the value (in values mode) or interval bound (in intervals mode), the number of samples in the given level (in the Count column) and the percentage of total values in the given level (in the Count % column). The break-down table contains additional columns when a target attribute is specifed.
The attribute box can be enlarged by ticking the Exp check box. The attribute box expands so that the whole break-down table can be viewed without scrolling.
It is possible to display only a selection of attributes. There are two ways to do this:
- Select the attributes of interest (using Shift or Ctrl keys as modifiers if necessary) and choose from the context menu.
- Enter space-separated attribute names (or parts of names) in the attribute name filter input box in the Freq toolbar and hit Enter. Only attributes with names matching one of the input strings will be displayed.
To display all the attributes again select from the context menu or remove all text from the filter box and hit Enter.
There are three display modes for attributes: values, intervals and statistics. To change the display mode of an attribute, select it and click the appropriate button in the Freq component toolbar.

Values mode. This is the default mode for categorical attributes and for numerical attributes with small number of values. In this mode each value of the attribute is represented by a separate bar on the histogram and a separate line in the values breakdown table.
Values mode is available for both categorical and numerical attributes, but for numerical attributes with large number of values the histogram may yield little analytical insight. In such cases the intervals mode is a better choice.

It is possible to combine two or more values into one group represented by one bar on the histogram and one line in the break-down table. See the Editing levels and grouping values subsection below.
Intervals mode. This is the default mode for numerical attributes with large number of values. By default, the value range of an attribute is divided into 20 intervals.
Intervals mode is available only for numerical attributes.

It is possible to change the settings for calculating the intervals. See the Editing levels and grouping values subsection below.
Statistics mode. In this mode the break-down table is replaced by a table which lists a number of attribute statistics: minimum value, 1st quartile, median, mean, 3rd quartile, maximum value, standard deviation, variance, kurtosis and skewness.
Statistics mode is available for numerical attributes only.
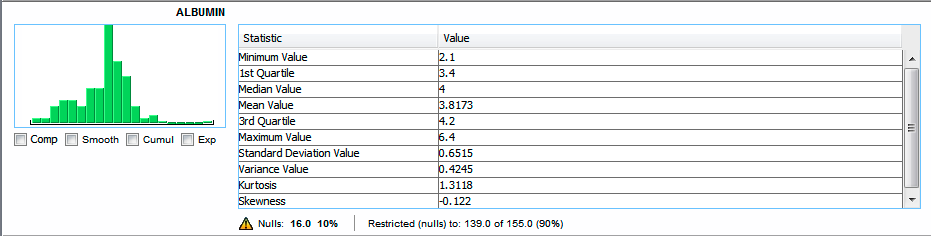
See the Basic attribute statistics section for the description of various statistics available in the statistics mode.
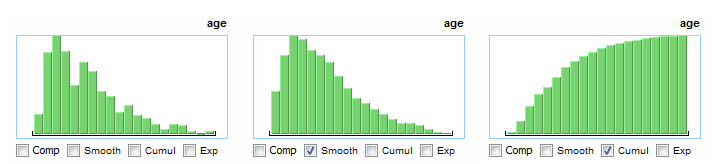
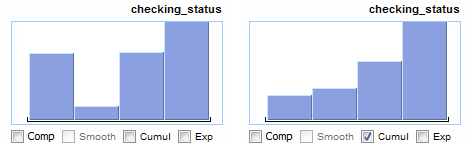
There are three types of histograms available in Freq: standard, smooth and cumulative. Smooth histograms are available only for attributes with 5 or more values.
To display a smooth or cumulative histogram tick the appropriate check box below the histogram display. Untick the chceckbox to return to the standard histogram.
Standard histogram. In a standard histogram each bar and line in the break-down table corresponds to samples with one value/category or from one interval, depending on the attribute display mode.
Cumulative histograms. In the case of categorical attributes, in a cumulative histogram in intervals mode each consecutive bar (and line in the break-down table) represents all the samples whose category preceeds or equals the category for this bar. In the case of numerical attributes, each bar in a cumulative histogram represents samples with values lower than the upper bound of the interval this bar represents (or lower or equal to the value corresponding to this interval in values mode).
Smooth histograms. Smooth histograms represent a smoothed approximation of the distribution of attribute's values obtained using kernel density estimation.
By default the histograms are created according to the following rules:
- in the intervals mode for numerical attributes interval lengths are uniform, values are divided into 20 intervals and the value count of the first interval is the same as that of the second interval and the value count of the last interval is the same as that of the penultimate interval.
- in the values mode there is one bar in the histogram and one entry in the break-down table for each value attained by the variable.
Any changes in the way an attribute is divided into levels are saved when the Freq component is closed.
It is possible to group values together or change arbitrarily the division into intervals. There is a number of ways to do this.
Select a range of required values or intervals on the histogram or in the break-down table and choose from the context menu. In the case of values view this will collapse the selected values into one bar on the histogram and one entry in the break-down table. In intervals mode this action will replace all the levels between the lower bound of the first level in the selection and the upper bound of the last level in selection with one interval.
Note
In the case of intervals mode it may be necessary to recalculate the attribute to display the histogram properly after grouping levels.To change the name for a group created in this manner select from its context menu. Select from the context menu to break up the group back into original values.
It is not possible to ungroup joined intervals in the case of intervals mode. The restore the original division into intervals simply recalculate the attribute.
Select from the attribute's context menu to open the Edit levels dialog, in which level boundaries or value groups can be defined manually.
If the attribute is in values mode, values are separated by commas. To create a group from more than one value, enclose a comma-separated list of these values in square brackets (see the figures below).
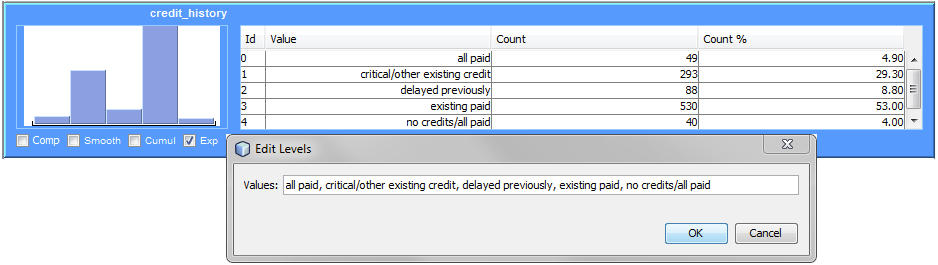
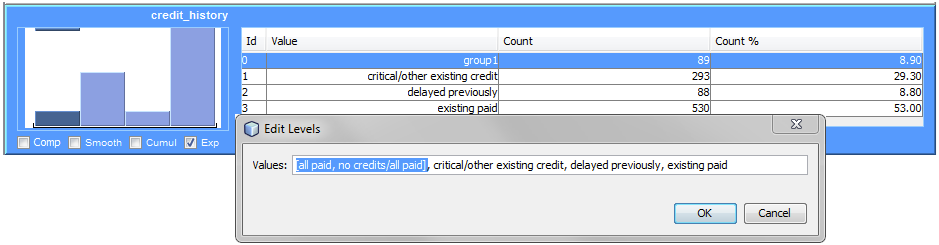
If the attribute is in intervals mode, the interval boundaries are separated by spaces. Double period (..) corresponds to +/- infinity for the last and first interval respectively (see the figure below).
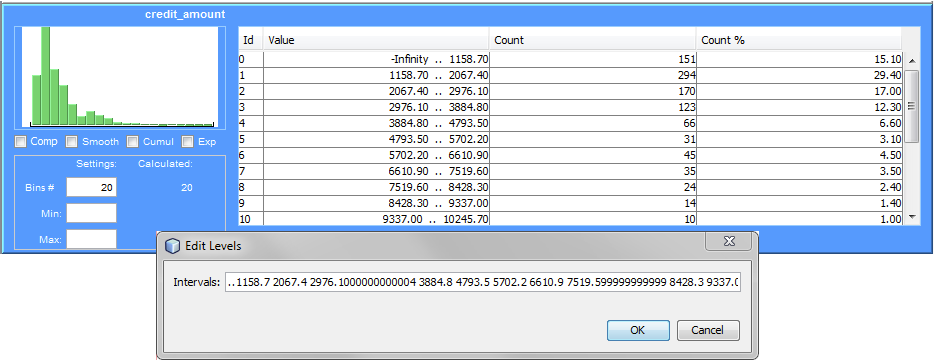
In the case of intervals mode it is possible to change levels in the following way:
- To change the number of intervals enter the appropriate value in the Bins # input field below the histogram display.
- In the Min. field enter the minimum value for the lower bound of the second interval. The first interval will include all values lower than Min. Similarly, in the Max field enter the maximum value of the penultimate interval. The last interval will include all values greater than Max.
- Calculate the attribute again to display the histogram and break-down table with the new settings applied.
Another way to set the values for Min and Max is to select a range of levels in the histogram or the break-down table and choose from the context menu.
With the exception of the first and last intervals, all the intervals will be of equal length. If the value for Min is not given, it will be determined automatically so that the first two levels are of equal count. The same holds for and the last two levels.