Table of Contents
This chapter describes three kind of reports dedicated to validate scoring models:
- efficiency report
- statistical test report
- stability report.
All of them were created with a view to deeply analyzing scoring model and scoring card. However the first and second report may be used for any kind of classification model that is able to assign score (probability or points) to each observation. Only the third report requires scoring card with scoring points.
Because all the report are generated in MSOffice or OpenOffice user must remember to set appropriate connection. For help see Integration with common office suites chapter.
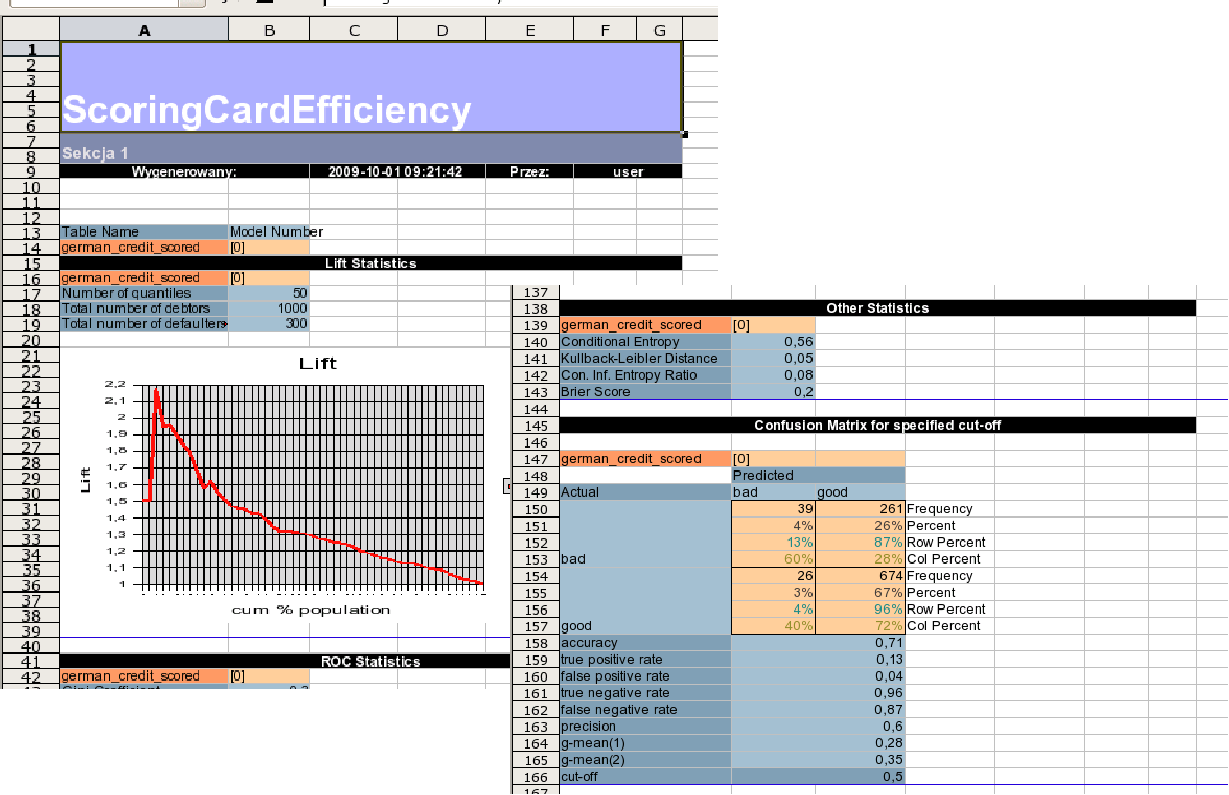
This report contains the following statistics:
- Lift chart,
- ROC curve with confidence intervals and additional statistics: Gini Coefficient, ROC Area, optimal cut-off,
- K-S Chart and additional statistics: K-S Statistic, Pietra Index, Bayesian Error Rate, optimal cut-off,
- CAP curve and Accuracy Ratio statistic,
- Confusion Matrix for different cut-offs and additional classification statistics,
- other statistics: Conditional Entropy, Kullback-Liebler Distance, Conditional Information Entropy Ratio.
Some of the listed statistics were described in Classification Test Task Result section. All the statistics are calculated according to the document: „Working Paper No. 14: Studies on the Validation of Internal Rating Systems”, Basel Committee on Banking Supervision, May 2005.
To generate the Efficiency Report we need build and apply classification model first. After that in database we should have an 'applied' dataset with at least two columns: original target and predicted probability or score. Then we can run the report with the script below:
from base.report.statReport.ScoringCardEfficiency import *
runScoringCardEfficiency()
After running this code the wizard will appear where two kinds of parameters must be set:
- Data Source - general parameters about analyzed data: alias, scored dataset, target and score attributes, positive target value and type of score attribute (score points or probability)
- Report Settings - some output statistics parameters.
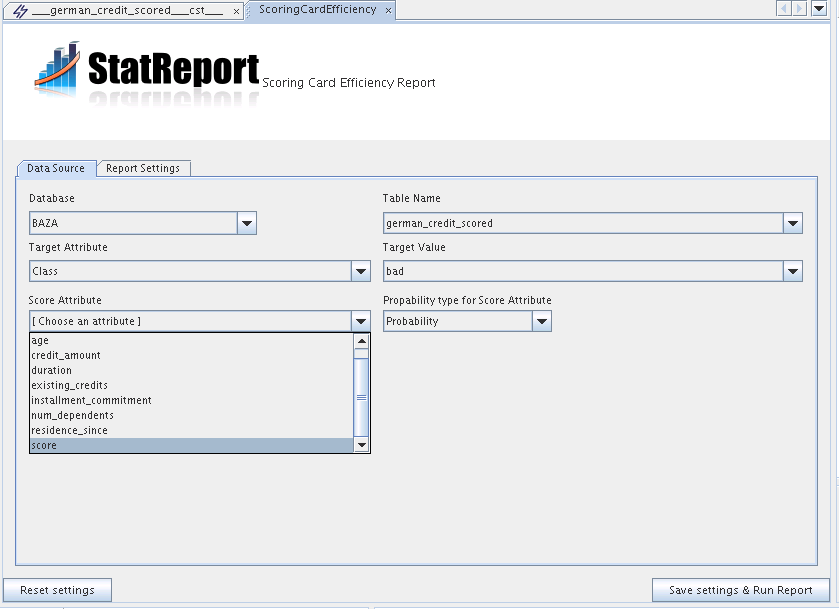
After setting all the parameters just click 'Save settings & Run Report' button. A few seconds later the report should generate.