Table of Contents
Freq is a component for on-the-fly data exploration and model evaluation with a streamlined graphical user interface. The main capabilities of Freq are:
- quick overview of attributes, including histograms and basic statistics,
- calculation of common attribute statistics,
- ability to restrict the dataset to particular classes of records by manually indicating items of interest or performing simple sql queries,
- ability to visually compare the attributes subject to different sql filters,
- support for target attributes,
- virtual attributes calculated on the basis of existing ones,
- correlation matrix,
- exporting to Excel spreadsheets,
- binding to other, related components.
Freq is a graphical component corresponding to the CalculateStatisticsTask object in the metadata repository.
Freq can be launched directly from the AdvancedMiner's user interface or by creating the CalculateStatisticsTask object either by script or manually and opening it.
To create Freq from the user interface do one of the following:
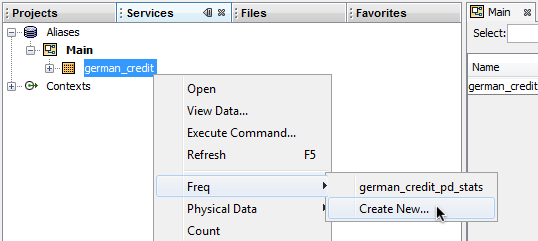
- In the Services component under the Aliases node expand the node corresponding to the database, select the appropriate table and choose -> from the context menu.
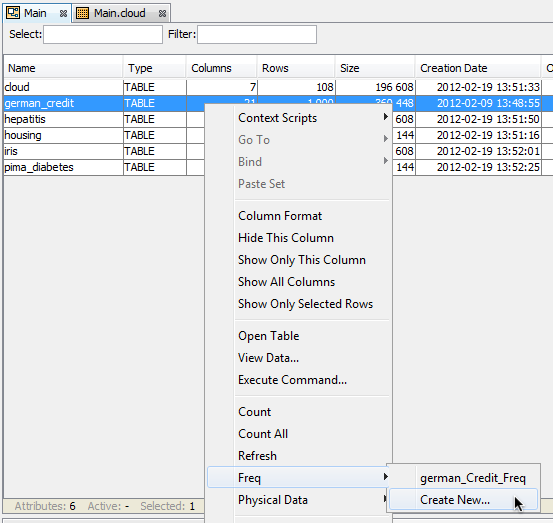
- In the database explorer component select the row of the appropriate table and select -> from the context menu.
- In the table overview component select -> from the context menu.
- In the table overview component select the rows corresponding to the variables of interest and choose from the context menu. This creates a new Freq component and automatically calculates the statistics for the selected variables.

Note
If more than one metadata repository is connected an intermediate submenu will appear allowing the user to choose in which repository the calculateStatisticsTask object should be created.Following this action a new component window called tableName_pd_stats is opened
In each case described above the following objects are created in the metadata repository:
- a physicalData object corresponding to the database table called tableName_pd.
- a calculateStatisticsTask object for the just created physicalData.
When a calculateStatisticsTask object for a given table already exists it is also possible to open it in the same manner as creating a new Freq component, but by selecting -> from the context menu instead.
To create a calculateStatisticstask object proceed according to the following steps:
- If a physicalData object corresponding to a given table does not exist in the metadata repository, create one by selecting -> from the repository's context menu. Next provide the information about the database alias and table name requested by the New File wizard and click .
- Select -> from the repository's context menu and in the New File wizard choose CalculateStatisticsTask as the type of task, click , enter your name for the object and click .
Next, open the newly created CalculateStatisticsTask object to open the Freq component. Alternatively, select -> from the database table's context menu in the services component, database explorer, or table view component.
It is also possible to automate the creation of physicalData and CalculateStatisticsTask object with a Gython script. The example below shows how to achieve this.
Example 12.1. Calculate statistics task:
if not tableExists('german_credit'):
 raise "Table 'german_credit' does not exists. Please run german_credit.py script from data directory first"

# create and save physical data
pd = PhysicalData('german_credit')
save('pd', pd)

# create calculate statistics object
cst=CalculateStatisticsTask()
# set physical data
cst.setPhysicalDataName('pd')
# statistics will be calculated for 'Class' attribute
cst.getStatisticsSettings().addAttribute("Class")

save('cst', cst)
execute('cst')

# load discrete statistics for 'Class' attribute
discVal = load('pd').getAttribute("Class").getAttributeStatistics().getDiscreteStatistics()

print "Modal:",discVal.getModal()
print "Maximal values count:",discVal.getMaxValuesCount()
print "Number of discrete values:",discVal.getNumberOfDiscreteValues()

# print value and frequency
strFormat = "%-30s%-4s"
print strFormat % ("Value", "Frequency")
for item in discVal.getDiscreteValues():
    print strFormat % (item,discVal.getValueCount(item))
Output:
Modal: good
Maximal values count: 100
Number of discrete values: 2
Value                         Frequency
good                          700
bad                           300
The freq component consists of a toolbar and a scrollable list of attribute boxes, in which histograms, value break-down tables and other information are displayed. The figure belows shows the elements of Freq's graphical user interface.
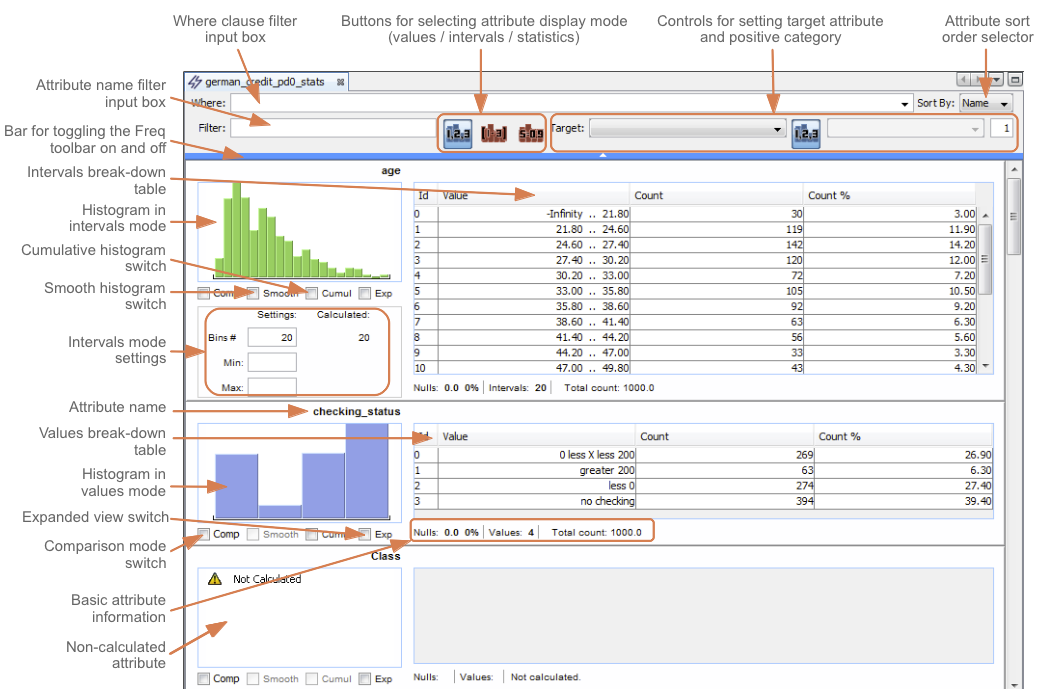
Depending on how Freq has been launched the statistics for some attributes may be calculated or not. See the Calculating attributes subsection.
The order in which attributes are displayed can be changed with the Sort By pull-down list in Freq's toolbar.