The algorithm can handle numerical as well as categorical attributes. It is not required to binarize or standardize the data prior to tree building. The only limitation is for the number of values of the nominal attribute. Typically, this number cannot exceed 100.
Null values are fully supported.
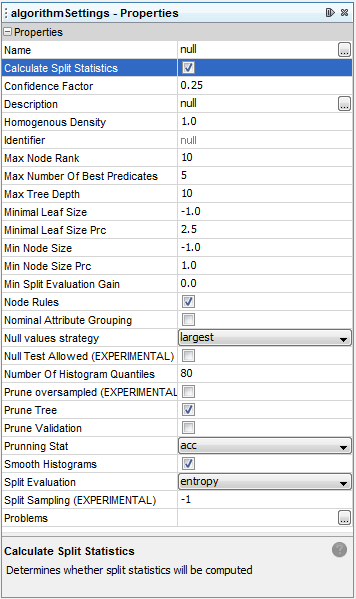
Only some of the attribute usage types are applicable for the Classification Tree module. The supported attribute usage types are: active, target, inactive and weight. Only one target can be selected.
The following films illustrate the creation process of classification tree models in AdvancedMiner:
Full specification of the model settings contains the elements of the General Algorithm Settings and Transformation Settings.
The class responsible for providing the algorithm settings specific to Classification Trees is TreeSettings. See javadoc for the programming details of using it from Gython.
Table 30.1. TreeSettings properties summary table
| Option | Description | Possible values | Default value |
|---|---|---|---|
| Min Node Size | the minimum number of cases required to create a node, inactive when MinNodeSizePrc is used | Non-negative integer numbers | 1 |
| Min Node Size Prc | the minimum number of cases required to create a node, expressed as a percent of training set size | Real numbers from the interval [0.0, 100.0). Inactive when set to 0 | 5 |
| Max Tree Depth | the maximum depth of the tree | Non-negative integer numbers, 0 means no restriction | 10 |
| Confidence Factor | the confidence factor used in pruning | Real numbers from the interval [0.0, 0.5) | 0.40 |
| Prune Tree | toggles tree pruning after building | true / false | false |
| Split Evaluation | the split evaluation criterion | entropy / gainRatio / gini | gini |
| Max Node Rank | the maximum number of children in each node | Integer numbers >= 2 | 2 |
| Max Number of Best Predicates | the maximum number of best predicates in each node | Integer number >= 0 | 5 |
| Nominal Attribute Grouping | decides whether the algorithm will try to group nominal values when creating the test | true / false | false |
| Homogeneous Density | the smallest density of any target in a node to justify changing it into leaf | Real numbers from the interval (0.0, 1.0] | 1.0 |
| Min Split Evaluation Gain | the minimum gain in split evaluation value required to continue splitting a node | Real numbers from the interval [0.0, 1.0] | 0.0 |
| Number of Histogram Quantiles | the number of histogram quantiles for split attribute | Integer numbers >= 1 | 80 |
| Smooth Histograms | determines whether histograms for split attribute will be smooth | true / false | false |
| Calculate Split Statistics | determines whether split statistics will be calculated | true / false | true |
| Null values strategy | Determines how null values are treate by the algorithm | weighted / largest / left / best | largest |
| Null Test Allowed (EXPERIMENTAL) | Experimental Feature. If true, than the algorithm will try to use the "variable is null" split test | true / false | false |
| Prune Oversampled (EXPERIMENTAL) | Experimental Feature. If true, than the pruning process will be executed on an oversampled target distribution | true / false | false |
| Prune Continuous | If true, error for prunning will be calculated as difference between observed and predicted probability, if false, than error will be the number of misclassifications when cut-off is 0.5 | true / false | false |
| Evaluation Null Correction (EXPERIMENTAL) | Experimental Feature. If true, than a split for an attribute with null values is evaluated as worse compared to split for attribute without null values | true / false | false |
- Min Node Size
This parameter determines the minimum number of samples in a node. A given node is split if all its child nodes would be assigned at least Min Node Size samples. In effect, the constructed tree does not have any nodes with less than Min Node Size samples. This constraint holds in the building phase, but might not hold after pruning.
- Max Tree Depth
This parameter determines the maximum tree depth. The tree in the building phase, before pruning, will contain at most the number of levels specified by this parameter. The value 0 means there is no restriction as to the tree depth.
- Confidence Factor
This parameter sets the confidence factor used to estimate the error made by the tree during the pruning process. It is used by Pessimistic Error Pruning, when the pruneTree option is set to 'yes'. The smaller the value of this parameter, the more often subtrees will be replaced with leaves, ultimately resulting in a smaller tree.
- Split Evaluation
This option chooses the split evaluation function used by the classification algorithm. It influences the manner in which the samples are split in each node. It also impacts the result of nominal attribute grouping, if the option is turned on.
The possible values are:
- Max Node Rank
This parameter determines the maximum number of children a node can have. It is valid only for nominal attributes, as numeric tests always have a binary outcome.
The meaning of this parameter depends on whether Nominal Attribute Grouping is on or off.
Nominal attribute grouping is ON: First the algorithm tries to group the attribute values, in each step joining two best values together. This process stops when any attempted joining would decrease the assessment value. If in the end the values are split into no more than Max Node Rank subsets and a child node is created for each subset. Otherwise a binary split is used.
Nominal attribute grouping is OFF: If the number of possible values of an attribute does not exceed Max Node rank a multi-value split is used. Otherwise, a binary split is used.
- Nominal Attribute Grouping
This option decides whether nominal attributes should be grouped at each node. For example, if an attribute can attain the values {A,B,C,D,E}, one possibility is a binary test of the form "equal/not equal B". Another possibility is to create a separate child node for each value. However, with Nominal Attribute Grouping turned on the values can be divided into subsets, for example {A,E} and {B,C,D}. Value grouping is performed independently for each node. Setting this parameter to 'on' may significantly influence the tree building time.
For details concerning the value grouping algorithm, see JR Quinlan. C4.5 Programs for machine learning, chapter "Grouping Attribute Values"
Note
This settings works in conjunction with the Max Node Rank parameter. If the created grouped splits generate more children than that parameter, the generated grouped split will not be used.
- Homogeneous Density
This parameter sets the smallest density of any target in a node to justify changing it into a leaf. A node for which the frequency of the target value exceeds the maximum value is considered to be homogeneous, i.e. no further splitting is necessary. Such node is turned into a leaf.
If set to 1.0, a node is considered to be homogeneous only when all the cases in this node have the same target category. The default value is 0.0, meaning this stop criterion is inactive.
- Min Split Evaluation Gain
This parameter determines the minimum gain in split evaluation required to split a node. The split evaluation is calculated using the function set by the splitEvaluation parameter.
A node is split only when the split evaluation value is greater or equal to min split evaluation gain. Otherwise a leaf is created.
- Null values strategy
This parameter determines how null values encountered in the data are treated by the algorithm:
weighted - an observation propagation from root to leaf is used and every time a conditionn is tested on a variable with a null observation two observations with smaller weights are created;
largest - every time a condition is tested on variable with a null observation this observation is assigned to the largest sub-tree;
left - every time a condition is tested on variable with a null observation this observation is assigned to the left sub-tree;
best - every time a condition is tested on variable with a null observation this observation is assigned to the best sub-tree;
In addition to the settings specific to the Tree algorithm, the user can use Transformation Settings - to control the way of data transformation; these settings are described in the Transformations chapter.
When all the metadata objects are prepared and the build task specification is valid, the user can execute the task. The execution consist of three stages:
Loading the input data into memory
On the progress indicator on the Remote Processes window, this process corresponds to the values from 0% to 20%.
Building the tree
On the progress indicator on the Remote Processes window, this process corresponds to the values from 20% to 100%.
Tree pruning. Not reflected on the progress indicator.
All steps are reported in the logger system at the INFO level.
At any stage the user can request to terminate the task. If the task is terminated, no model object is created.
The Classification Trees module is capable of creating three output types when classifying the provided data. For details on how to apply the model to the data see the Applying Models in AdvancedMiner chapter and the Classification subsection in the Applying for different mining functions section.
The application of the Classification Trees module can yield three possible outputs: category, probability, and (with some restrictions) nodeid. The table below presents possible combinations and their description.
Table 30.2. Output items and output types combinations
| Output type | Output item type | Description |
|---|---|---|
| probability | rank | returns the probability of the n-th best category |
| probability | category | returns the probability of classifying as the given category |
| category | rank | returns the n-th best category |
| category | category | not supported |
| nodeID | category | not supported |
| nodeID | rank | returns the id of the leaf to which the input case was assigned |
The probability is calculated based on the concentration of the
given target value in the leaf to which the case was assigned. If
 is the size of the leaf and
 the number of cases with the selected target
value then the returned probability is equal to
the number of cases with the selected target
value then the returned probability is equal to

After executing the build task, a tree model is created in the repository. The model contains information about the tree structucture, target levels and observation counts in every node. The model can be viewed in the Tree Visualization Component, the structure can also be inspected in the Project Window by browsing objects.
The visualization for the Classification Tree model is created in a graphical environment which allows moving and zooming of content. The amount of information information displayed on the tree diagram increases with the zoom level.
The visualization of the tree is controlled using the mouse and/or keyboard.
Mouse controls:
scroll - press the left mouse button and move the mouse to scroll the tree in the desired direction;
zoom - mark the point which will be the center of the zoom by pressing the right mouse button and, while holding it down, move right to zoom in, or left to zoom out. The horizontal (X axis) distance between the marked point and current cursor position determines the speed of zooming. If the current cursor position has the same X coordinate as the marked point, nothing happens. The more the cursor is to the left, the faster is the zooming out. The more to the right, the faster the zooming in.
restore view - if the tree is moved out of the preview box double click the left mouse button to make the root reappear.
quick zoom - shift+click with the left mouse button on a node to zoom in or out of it, depending on to the current scale;
node select - click the left mouse button on the node; to deselect it just select another node or click on the background; Each time a node is selected, the properties of that node are shown in the properties window. See also the Node properties animation.
Keyboard controls:
quick zoom into the selected node - press Enter when the tree is zoomed out or Backspace when the tree is zoomed in;
change node selection - use the arrow keys: down - go to the first (left) child; up - go to the parent; left/right - go left, right on the same tree level;
Animations: Navigation with mouse. Navigation with mouse part II.
Besides changing the tree scale and placement, there is a number of options that can change the view. All are grouped inside the 'Properties' and can be accessed when the tree component is activated.
Visibility. This group of parameters specifies what elements are visible:
Flow - the flow of the observations from the data set,
Histogram - the histogram of target values in the node,
Legend - color legend for target values;
Node Size - the number of observations that fall into a node,
Split Attribute - the name of the split attribute,
Split Value - the value of the split,
Target Values - the names of target values.
Properties. These are the general parameters of the visualization:
Color Code - [ Purity, Size, None] what is coded using colors: Purity - the level of the predicted value, Size - how many observations have fallen into a node, None - no colors,
Cut - [Hidden, Shown] view for manually pruned nodes: Hidden - all nodes are hidden, Shown - pruned subtrees are shown, the prunned place is marked with a gray line,
Display - [ Full, Leaf] which nodes are shown: Full - all nodes are shown, Leaf - only leafs are shown,
Flow Content - [Validation diff, Observations count] type of information presented by edge color: Validation diff - difference between train and validation statistics, Observations count - number of observations in a node,
Histogram - [ Lift, Distribution] the type of histogram which is displayed in a node: Lift - lift in proportion to the root node, Distribution - the distribution of target values in a node,
Limit categorical - if true, than categorical values will be limited to the most frequent values only.
Target Visibility - specifies the values of which target are visible;
Color Scales - in the current version there is only one color scale, used for flows. A custom color scale editor is available, which allows for precise definition of the gradient.
Figure 30.7. Tree visualization and its properties.
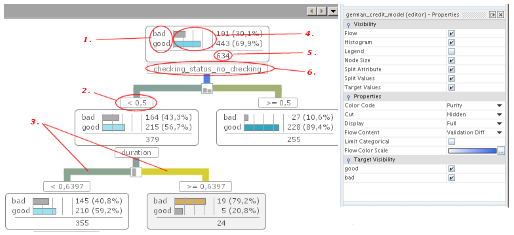
target value,
split value,
color for the flow,
histogram,
node size,
split attribute.
Figure 30.8. Visualization of a tree node
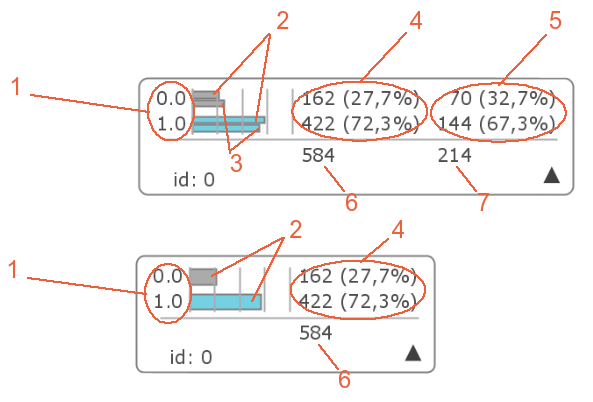
target value,
target distribution for train data (graphical)
target distribution for validation data
target distribution for train data
target distribution for validation data
total train observations
total validation observations
Animations illustrating working with tree editor properties part I - flow , part II - showing and hiding information , part III - changing from full tree to leaf only mode .
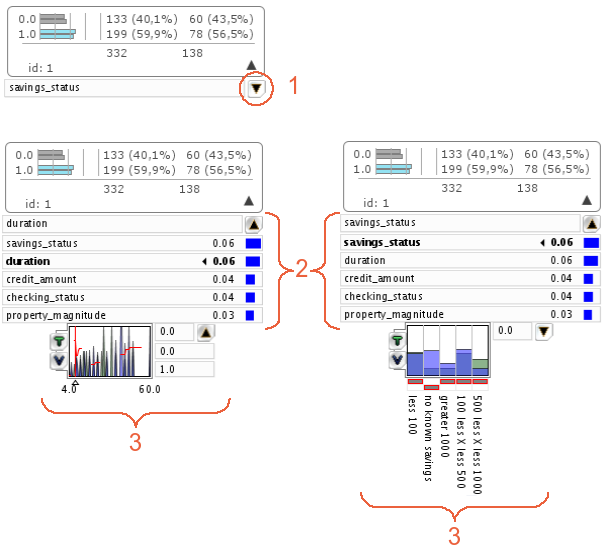
The figure below shows the tree split editor. The split editor can be accessed through a button right to split attribute name (1). According to split attribute type, editor is numerical (left) or categorical (right). The editor has two areas:
2 - best splits. Contain list of N best splits. Splits are ordered by split evaluation value from top (best split) to bottom (worse split). Each split has attribute name and split evaluation value. The active split is marked as bold.
3 - split value editor. It is possible to inspect or modify the split value.
Animation: Interactive tree editing - changing split predicates and tree relearning .
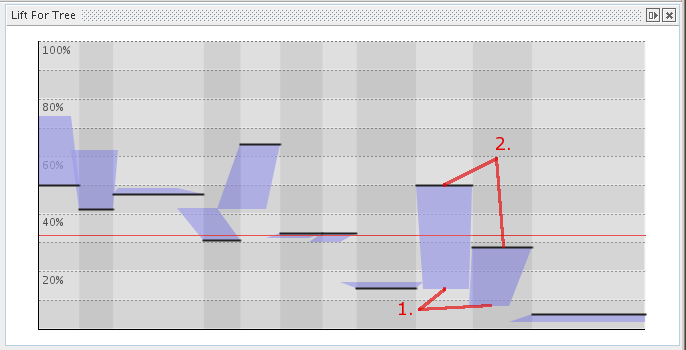
If validation data is used for model building, models statistics shows the tree lift. The tree lift shows a lift chart for two data sets: train and validation. The lift for validation data is shown as bold lines (2.), and lift for train data is shown as blue edge (1.). The blue area shows difference in lift value for a given node between train and validation sets.
The tree lift diagram is interactive. It can be used for prunning/unprunning leaves and for selecting nodes and leaves. See the animations: Working with tree lift , prunning nodes with tree lift.
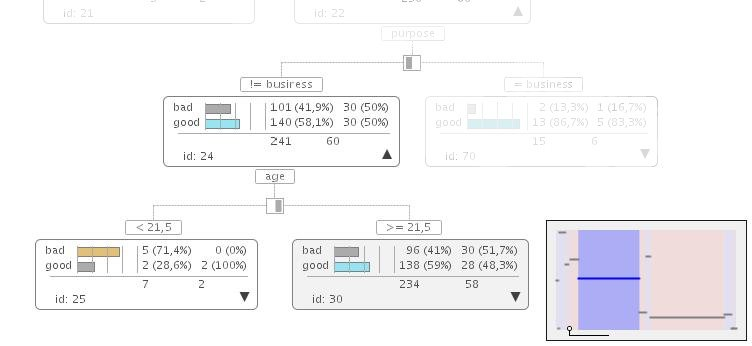
When a leaf is selected the associated leaves are marked on the lift. On the example figure, leaf-30 is selected. Every operation that can be done on this leaf will affect all children of leaf-30's parent. In this case only leaf-25 is affected. The blue tab on lift is used for marking the selected leaf. The line below the lift connects the marked leaf with the affected leaf.
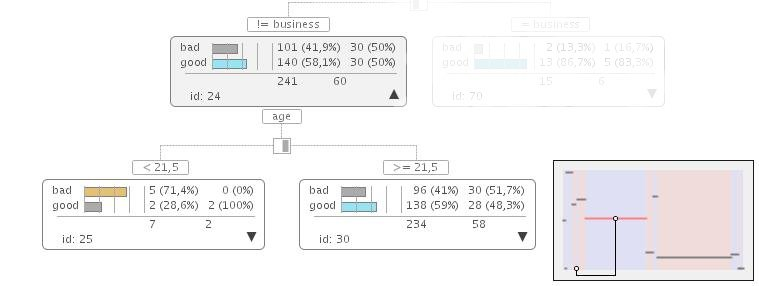
A node can be also selected. The child leaves of the node are marked with red color. They are also connected.
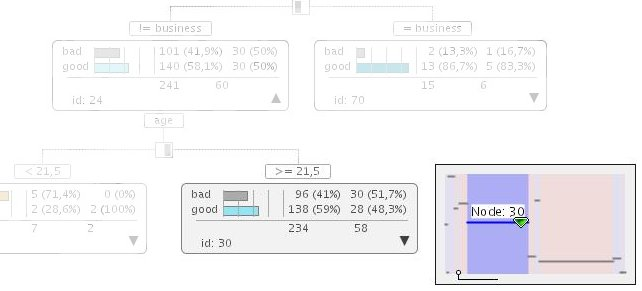
The black triangle pointing down on leaf-30 means that the leaf can be uprunned. The lift can also be used to prune and unprune leaves. To prune and unprune a leaf click the black triangle on the desired tree item. On lift press CTRL and move the mouse to the desired mode. Left click if a green triangle appears to unprune a leaf. Left click if scissors appear to prune leaf.
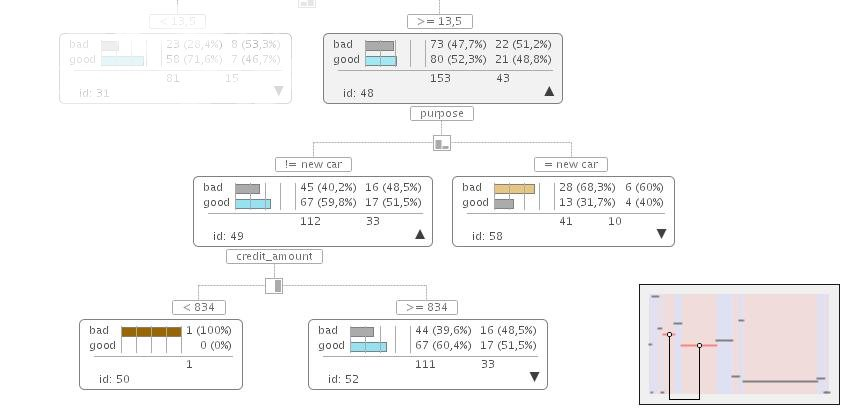
Some nodes do not have the validation set observation count. In the figure above leaf-50 has empty validation set statistics. So leaves 52 and 49 are treated as identical and as one leaf on the lift. When node-48 is selected the lift shows leaves 49 and 58 as marked.
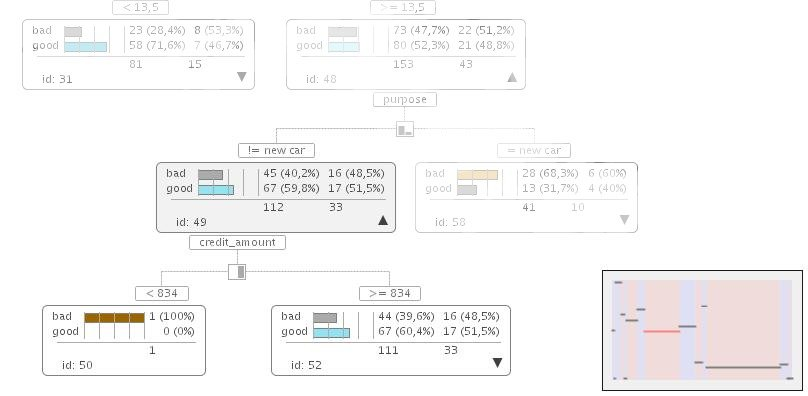
The figure above shows a similar situation.
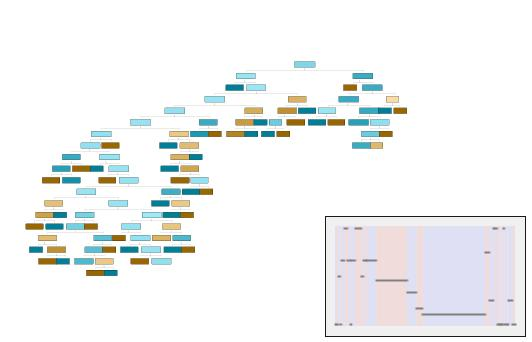
The lift makes working with a tree much easier. It shows all outlying an unneeded behavior. The figure below shows a large tree for which the lift contains many outlying values
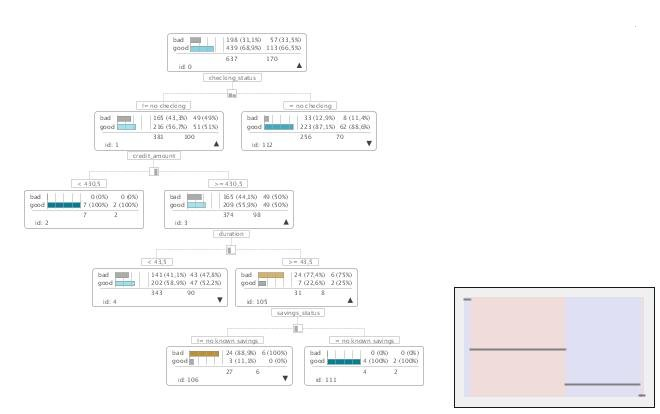
The next figure shows a pruned tree. The tree consists only of 5 levels and its lift is monotonic.
There is number of options that can change the lift view. All are grouped inside the 'Properties' and can be accessed when the tree component is activated.
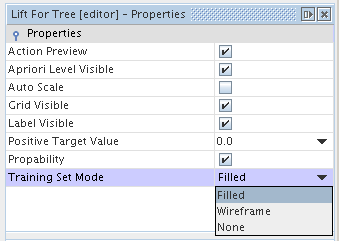
Lift properties:
Action Preview - preview of possible prunning actions,
Apriori Level Visible - visibility of apriori line,
Auto Scale - scale lift preview to the maximum value,
Grid Visible - show grid,
Label Visible - show node id for selected lift area,
Positive Target Value - select positive target value,
Training Set Mode - controls how the training set lift is displayed.
This section shows, how an existing tree model can be viewed. Viewing is possible both by working with the properties window and by using a scripting language. For detailed descriptions of all fields and properties for the tree model, please refer to the JavaDoc documentation for the biz.sc.mm.dm.modelstats.tree package. The created model, as every model in AdvancedMiner, contains function settings, signature, and model statistics as shown in the picture below.
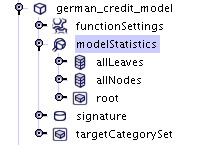
Every object here can be inspected in the properties window. The figure below shows statistics for an example model. The object contains summarized information about the tree structure.
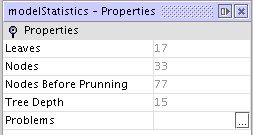
Model statistics for trees (TreeModelStatistics interface) have some specific child nodes. AllLeaves is the list of all terminal nodes in tree. AllNodes contain all nodes in the tree after pruning. Root provides access to the root node and all its descendants.
The nodes also have also properties, as shown in the figure below.figure:
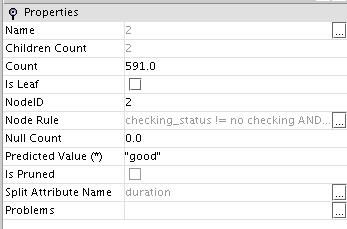
See also the animation: Working with tree model statistics.
The created classification tree model is editable. It is possible to change nodes, subtrees, and splits in an existing model. The changes are fully taken into account while applying, testing and generating scoring code. Here is the list of available operations (not all of them can be performed using the graphical editor, some of them require Gython scripting):
prune node
change the threshold for a numeric split or change the value for a categorical split
copy part of the tree from one model to another
change the target levels for a leaf (which are used as aposteriori probabilities)
As mentioned in the Introduction, classification trees can help analyze the importance of attributes. Statistics connected with it can be found in model signature node.
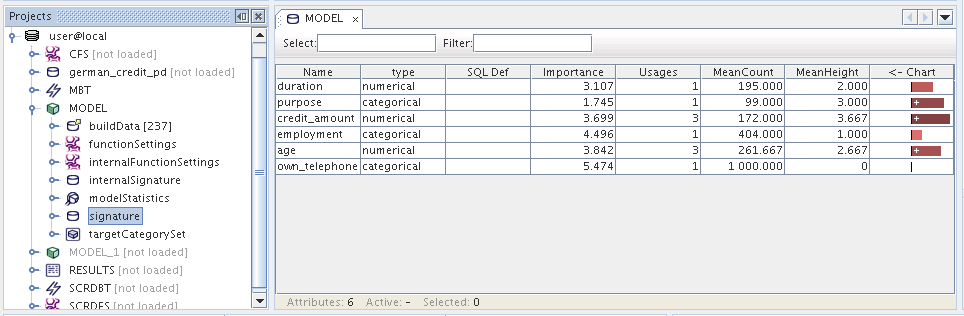
The following model importance statistics are available:
For a given attribute V the G importance coefficient is calculated using the formula:
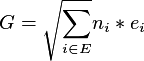
where
 - all nodes
with split on attribute V
- all nodes
with split on attribute V
 - the number of
observations in node i
- the number of
observations in node i
 - split evaluation value
for node i (e.g. gainRatio value)
- split evaluation value
for node i (e.g. gainRatio value)
The number of splits with attribute V
The average count of observations in all nodes with split on attribute V.
The average level of all splits on attribute V.