It is possible to create custom reports. Any data can be exported to a spreadsheets or text document. One can use styles, images, tables, and formatting rules. It is also possible to use charts for the exported data. This section describes how to create a custom report.
The MS Office and OpenOffice programs uses the same API so no separate description is needed.
Creating a new spreadsheet document is easy. The following script shows how to accomplish this.
spreadsheet = Office.createSpreadsheet()
The spreadsheet document can be used to accomplish the tasks listed in the table below.
Table 17.2. Methods for SpreadSheet objects
| Task | Method usage |
|---|---|
| Insert text data into a particular cell | setCellValue(columnIndex, rowIndex, "text") |
| Insert a numeric value into a particular cell | setCellValue(columnIndex, rowIndex, number) |
| Insert a formula into a particular cell | setCellValue(columnIndex, rowIndex, "formula") |
| Insert a data array at the specified destination cell | setCellValue(columnIndex, rowIndex, dataArray)
Formulas can't be inserted in this way.
|
| Set cell range style | setStyle(spreadsheet.getCellRangeByName("cell-range"), spreadsheet.headerStyle)
See also Cells and cell ranges
and Predifend styles.
|
| Merge cell range | mergeCells(spreadsheet.getCellRangeByName("cell-range"))
See also Cells and cell ranges.
|
| Increment the indentation of cell range content | incrementIndent(spreadsheet.getCellRangeByName("cell-range"), indentationLevel)
See also Cells and cell ranges.
|
| Decrement the indentation of cell range content | decrementIndent(spreadsheet.getCellRangeByName("cell-range"), indentationLevel)
See also Cells and cell ranges.
|
| Set column width | setColumnWidth(columnIndex, newColumnWidth) |
| Set optimal column width | setOptimalColumnWidth(columnIndex) |
| Insert a bar chart | see Inserting Charts |
| Insert a DataPilot | see Inserting a DataPilot |
| Insert a new sheet, activate a sheet | see Managing sheets |
Note
MS Office uses localized formula names, while OpenOffice does not. This affects the formulas with functions like SUM, MEAN, etc.
All of the above methods should be called as shown below:
spreadsheet.method(Paramter1, Parameter2, ... )
Where spreadsheet is the spreadsheet document object, created using: SpreadsheetWrapper(officeConnection.createSpreadsheetDocument())
See the basic example below:
# Create a spreadsheet document object
spreadsheet = Office.createSpreadsheet()

# Insert text data into the cell A1
spreadsheet.setCellValue(0,0, "Text example")

# Insert a floating point number into the cell A2
spreadsheet.setCellValue(0,1, 12.5)

# Insert an integer number into the cell A3
spreadsheet.setCellValue(0,2, 100)

#Insert a formula with style headerStyle into the cell A4
spreadsheet.setCellValue(0,3, "=A2*A3", spreadsheet.headerStyle)
A table can be exported to a spreadsheet for further processing. AdvancedMiner provides the readTable method which reads the table into memory as a two-dimensional array. The array can then be used to export the data into a spreadsheet. This is a fast method. (The listing below is a part of the tutorial script openoffice_import_data.gy)
The limitation of the spreadsheet is that only c.a. 65000 rows and 256 columns can be read into single sheet. If the data consists of more than 256 columns, it will be divided into separate sheets. There is no workaround for the row number limit.
Example 17.1. Exporting data to a spreadsheet
# After the connection is established a new spreadsheet document
# is created
spreadsheet = Office.createSpreadsheet()

# Create a new table using the standard table procedure
table 'openoffice_test1':
    a   b   c   d   e
    1   1   2   3   'ABC'
    2   2   1   3   'ABC'
    4   4   2   1   'DEF'
    1   1   2   3   'ABC'
    2   2   1   3   'ABC'
    4   4   2   1   'DEF'
    1   1   2   3   'ABC'
    2   2   1   3   'ABC'
    4   4   2   1   'DEF'

# Now the table is available in the database, so we can import
# it into OpenOffice

# At first write the header...
spreadsheet.setCellValue(0, 0, 'a')
spreadsheet.setCellValue(1, 0, 'b')
spreadsheet.setCellValue(2, 0, 'c')
spreadsheet.setCellValue(3, 0, 'd')
spreadsheet.setCellValue(4, 0, 'e')

# ...and next write the data
trans None <- 'openoffice_test1':
$spreadsheet.setCellValue(0, __rowNumber__+1, a)
$spreadsheet.setCellValue(1, __rowNumber__+1, b)
$spreadsheet.setCellValue(2, __rowNumber__+1, c)
$spreadsheet.setCellValue(3, __rowNumber__+1, d)
$spreadsheet.setCellValue(4, __rowNumber__+1, e)

# The task is done, but this is a very slow method and the user has
# to know column names
# There also is an optimized and fast method of reading a table into
# openspreadsheet.

# Add a new sheet to our spreadsheet document
sheet1 = spreadsheet.newSheet("FastImport")

# Read the table...
data = tableRead('openoffice_test1')
spreadsheet.setCellValue(0,0, data)
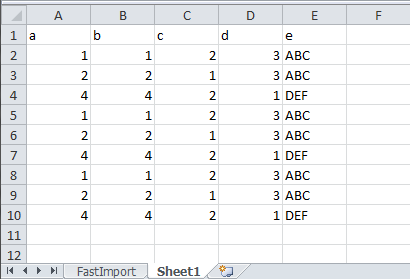
The above script opens a spreadsheet file with two spreadsheets, each of which containins the data from the openoffice_test1 table.
When working with a spreadsheet it is often necessary to select a single cell or a range of cells. Some methods also require cells or cell ranges as parametera. These objects can be obtained from a spreadsheet using the following commands:
# You can get a cell by its position (counted from 0)
sheet.getCellByPosition(0,0)

# You can get a cell range by name
sheet.getCellRangeByName("A1:C5")

# and get the cell range by position.
sheet.getCellRangeByPosition(0, 0, 2, 4)
AdvancedMiner supports inserting charts into office suite spreadsheets (only bar charts are implemented).
Charts in spreadsheets are created by adding a chart element and setting up the chart.
Example 17.2. Creating charts in a spreadsheet
spreadsheet = Office.createSpreadsheet()

# Prepare some data to write to the active sheet
values = [ ['Value', 'Count'],
           ['5', 300],
           ['6', 102],
           ['7', 105],
           ['8', 15],
           ['9', 5],
           ['10', 45]
         ]
# Writes the prepared data array to the sheet. Begining at the cell 0,0 (A1)
spreadsheet.setCellValue(0,0, values)

# Insert the chart
chart = spreadsheet.addChart("unique_name")

# Set where the source data is
chart.setDataRanges( collection( [ spreadsheet.getCellRangeByPosition(0,0, 1, 6) ] ) )
# the data range can consist of separate ranges, so it is necessary to use collection([ range1, range2, ...]) syntax

# The position and size of the chart is defined by another cell range
chart.setPositionAndSize( spreadsheet.getCellRangeByPosition( 0, 7, 6, 14) )

# The first row is a header
chart.setFirstColumnHeader( 1 )

# The first column contains data labels, so should be treated
# as a header
chart.setFirstColumnHeader( 1 )
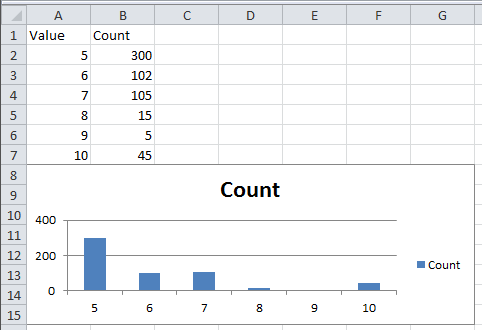
The spreadsheet created by this script is shown in the figure below.
AdvancedMiner provides the functionality to insert a DataPilot (pivotTable) into an office spreadsheet.
Example 17.3. Creating a pivot table
# After the connection is established a new spreadsheet document
# is created
spreadsheet = Office.createSpreadsheet()

# Create sample data
table 'openoffice_test1':
    a   b   c   d   e
    1   1   2   3   'ABC'
    2   2   1   3   'ABC'
    4   4   2   1   'DEF'
    1   1   2   3   'ABC'
    2   2   1   3   'ABC'
    4   4   2   1   'DEF'
    1   1   2   3   'ABC'
    2   2   1   3   'ABC'
    4   4   2   1   'DEF'

# Export the data into a spreadsheet
data = tableRead('openoffice_test1')

# Write data array into the spreadsheet
spreadsheet.setCellDataArray(0, 0, data)

# Some properties of the data pilot have to be set before it can
# be added to the spreadsheet
dpp = DataPilotProperties()

# Add column indexes which should be treated as columns
dpp.addColumn(1)
dpp.addColumn(2)
dpp.addColumn(3)

# Add a row index
dpp.addRow(0)

# Indicate which column should be used as the data for the
# data pilot
dpp.addData(4)

# Specify the source data range...
sourceCellRange = spreadsheet.getCurrentSheet().getCellRangeByPosition(0,0, 4, 9)

# ... and the destination of the inserted data pilot
destinationCell = spreadsheet.getCurrentSheet().getCellByPosition(0, 11)

# Insert the prepared data pilot
spreadsheet.insertDataPilot(dpp, sourceCellRange, destinationCell)
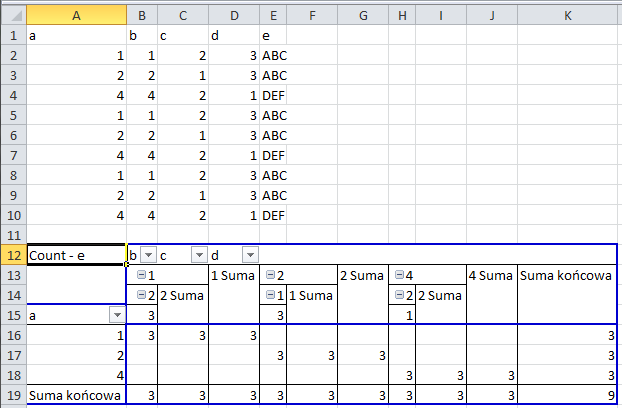
The spreadsheet created by this script is shown in the figure below.
When a connection with an office suite is established and a new spreadsheet document is created, a new sheet is created in this document. The new sheet is active and current which means that every operation is performed on the current sheet. A new spreadsheet in an active document is created with the newSheet method. It is possible to switch between active spreadsheets with the setActiveSheet method. See the script below.
# After the connection is established a new spreadsheet document
# is created
spreadsheet = Office.createSpreadsheet()

# Create a new sheet with the name "My new sheet"
sheet1 = spreadsheet.newSheet("My new sheet")

# Insert some data
spreadsheet.setCellValue(0,0, 'ABC')

# Create a new sheet.
sheet2 = spreadsheet.newSheet("Another sheet")

# insert some data
spreadsheet.setCellValue(3, 3, 'Hello World?')

# Activate the first sheet again
spreadsheet.setActiveSheet(sheet1)
It is important to realize that the new sheet becomes visible and current. One can switch between the sheets using setActiveSheet(sheetName) and setActiveSheet(sheetObject).
The Spreadsheet wrapper provides several predefined styles. The following table lists the predefined styles
Table 17.3. Predefined spreadsheet styles
| headerStyle | Standard style for headers |
|---|---|
| header1Style | Another standard style for headers |
| level1Style | Style for marking the first level of data |
| level2Style | Style for marking the second level of data |
| level3Style | Style for marking the third level of data |
| ooStyle | Empty style |
| rowLightStyle | Style for marking a row with light background |
| rowDarkStyle | Style for marking a row with dark background |
| whiteStyle | White background style |
| significanceStyle | Bold and large font style |
These styles can be applied to the following objects:
cell - using setCellStyle, or setCellValue
cell range - using setCellRangeStyle
rows, columns, cells in textTable in a text document
In fact predefined styles are sets of styles in the form of an array, so it is also possible to create custom styles. This is illustrated in the example below.
Example 17.5. Creating custom styles
spreadsheet = Office.createSpreadsheet()

# Create an empty array for styles
oStyle = []

# Use Office.createStyle to provide a style object.
oStyle.append(Office.createStyle(OStyle.CELL_BACK_COLOR, OStyle.COLOR_RED))
oStyle.append(Office.createStyle(OStyle.FONT_SIZE, 15))
oStyle.append(Office.createStyle(OStyle.FONT_WEIGHT, 150.0))
oStyle.append(Office.createStyle(OStyle.FONT_COLOR, OStyle.COLOR_WHITE))

#Now apply the prepared style to cell value
spreadsheet.setCellValue(1,1, "Some text", oStyle)
spreadsheet.setOptimalColumnWidth(1)
The following list contains the OStyle constants and their meaning
FONT_COLOR - font color, can be an integer number (RGB) or one of the predefined color constants
FONT_SIZE - font size in points
FONT_WEIGHT - font weight:. less than 100 means a normal font and more than 150 means a bold font
H_JUSTIFY - used to specify horizontal cell alignment
V_JUSTIFY - used to specify vertical cell alignment
BACK_COLOR - use this to set the background color for a font in a text document
CELL_BACK_COLOR - cell background color
COLOR_USER_DEF_1 - COLOR_USER_DEF_8 - colors definitions used by predefined styles
COLOR_RED - red color
COLOR_GREEN - green color
COLOR_BLUE - blue color
COLOR_BLACK - black color
COLOR_WHITE - white color
AdvancedMiner also supports text documents. The code below shows how to create a text document.
textDocument = Office.createText()
The following table presents the methods of text documents
Table 17.4. Text document methods
| Task | Method call example |
|---|---|
| Replace text in the whole document | setString(text) |
| Append text to the end of the document | appendString(text) |
| Insert text at the beginning of the document | prependString(text) |
| Set cursor style |
# sets char color to red - colors are given in hexadecimal RGB format
setCursorStyle(Office.createStyle(OStyle.FONT_COLOR, OStyle.COLOR_RED))

# sets bold font style
setCursorStyle(Office.createStyle(OStyle.FONT_WEIGHT, 150))
|
| Insert a paragraph break character | insertParagraphBreak() |
| Center the last paragraph | centerLastParagraph() |
| Left justify the last paragraph | leftLastParagraph() |
| Insert a table into a text document | textTable = createTable(rowCount, columnCount) |
| Insert data into the table |
setCellStringValue(textTable, "A2", "TextData")
|
| Set style for the whole table |
# set dark gray table background
setTableProperty(textTable, Office.createStyle(OStyle.BACK_COLOR, 0x606060))
|
| Set style for a row of a text table |
#set blue background color for the row at index 3
setRowProperty(textTable, 3, Office.createStyle(OStyle.BACK_COLOR, OStyle.COLOR_BLUE))
|
| Set style for a column of a text table |
# set green background color for the second column
setColumnProperty(textTable, 2, Office.createStyle(OStyle.BACK_COLOR, OStyle.COLOR_GREEN))
|
| Set cursor style for the specified cell in a text table |
# set small font size in A1 cell
setCellCursorStyle(textTable, "A1", Office.createStyle(OStyle.FONT_SIZE, 8))
|
| Insert an image |
insertImage("file://C:\gfx\graphic.jpg"),
insertImage("http://public/graphic.gif"),
insertImage("file:///home/user/gfx/graphic.png")
|
The methods should be called as follows:
textDocument.method(Parameter1, Paramter2, ...)
Images are inserted into a document as links.
The following example presents the basic reporting capabilities of text documents:
Example 17.6. Working with text documents
# Create a TextWrapper object, which acts as a text document
textDocument = Office.createText()

# Write the text
textDocument.appendString('First line of text, with standard style\n')
textDocument.appendString('This line is appended\n')

# Create a new paragraph and set its alignment
textDocument.insertParagraphBreak()
textDocument.appendString('This is new paragraph - it can have a different alignment than the first one');
textDocument.centerLastParagraph()

# Create a new paragraph and set another cursor style - bold font
textDocument.insertParagraphBreak()
textDocument.setCursorStyle(Office.createStyle(OStyle.FONT_WEIGHT, 150.0))
textDocument.appendString('...THIS IS BOLD')

textDocument.insertParagraphBreak()
# Bring back normal character weight
textDocument.setCursorStyle(Office.createStyle(OStyle.FONT_WEIGHT, 100.0))

# But set a different font color
textDocument.setCursorStyle(Office.createStyle(OStyle.FONT_COLOR, OStyle.COLOR_BLUE))
textDocument.appendString("\nBLUE MAX\n")
A good practice in using styles is to predefine some styles and then simply use them instead of creating new every time when there is a need.
Example 17.7. Defining custom styles for a text document
# Create a TextWrapper object, which act as spreadsheet document
textDocument = Office.createText()

# Prepare some useful styles
boldFont = Office.createStyle(OStyle.FONT_WEIGHT, 150)
normalFont = Office.createStyle(OStyle.FONT_WEIGHT, 100)
big = Office.createStyle(OStyle.FONT_SIZE, 20)
small = Office.createStyle(OStyle.FONT_SIZE, 8)

# Use the styles
textDocument.insertParagraphBreak()
textDocument.setCursorStyle(boldFont)
textDocument.appendString('...This is bold\n')

textDocument.setCursorStyle(big)
textDocument.appendString('...and BIG.\n')

textDocument.setCursorStyle(normalFont)
textDocument.appendString('This line is thin...\n')

textDocument.setCursorStyle(small)
textDocument.appendString('...and this small\n')
The next example demonstrates how to insert a table into a text document and how to set the styles for cell content, row and table background:
Example 17.8. working with a table in a text document
# Create a TextWrapper object, which act as a text document
textDocument = Office.createText()

textDocument.appendString("See the table below:\n")

# Create a table with three columns and four rows
textTable = textDocument.createTable(4, 3)

# Prepare the styles
lightRedBackground = Office.createStyle(OStyle.BACK_COLOR, 0xffe0e0)
darkGreenBackground = Office.createStyle(OStyle.BACK_COLOR, 0x408040)
whiteFontColor = Office.createStyle(OStyle.FONT_COLOR, OStyle.COLOR_WHITE)

# Set the table background to light red
textDocument.setTableProperty(textTable, lightRedBackground)

# Set the first row background to dark green color
textDocument.setRowProperty(textTable, 0, darkGreenBackground)

# Now write in the first row values using white font color
textDocument.setCellCursorStyle(textTable, "A1", whiteFontColor)
textDocument.setCellStringValue(textTable, "A1", "First column")

textDocument.setCellCursorStyle(textTable, "B1", whiteFontColor)
textDocument.setCellStringValue(textTable, "B1", "Second column")

textDocument.setCellCursorStyle(textTable, "C1", whiteFontColor)
textDocument.setCellStringValue(textTable, "C1", "Third column")