
Freq is a tool for visual data exploration using the Advanced Miner software. The advantages of Freq are innumerable, however, at the beginning, it is worth mentioning the following: quick overview of the attributes and calculation of their statistics, visual comparison of attributes, possibility of limiting data to specific classes, as well as export to Excel spreadsheets. In this post we will present the possibilities of Freq through operations on simple databases.
If you don’t have a free version of AdvancedMiner yet, download it here.
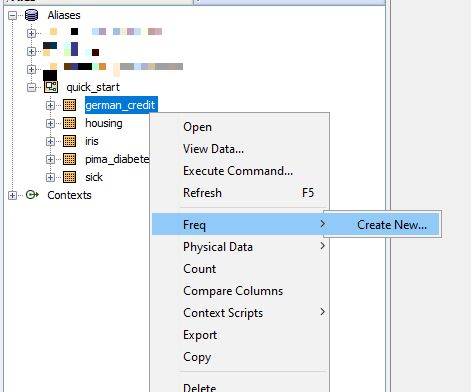
The easiest way to start Freq is to choose “Freq” after right-clicking on the selected database.
You can also go to the database explorer (“Open”) and select Freq.

Or for example, working in workflow.

Each of these options will open the graphical interface of Freq:
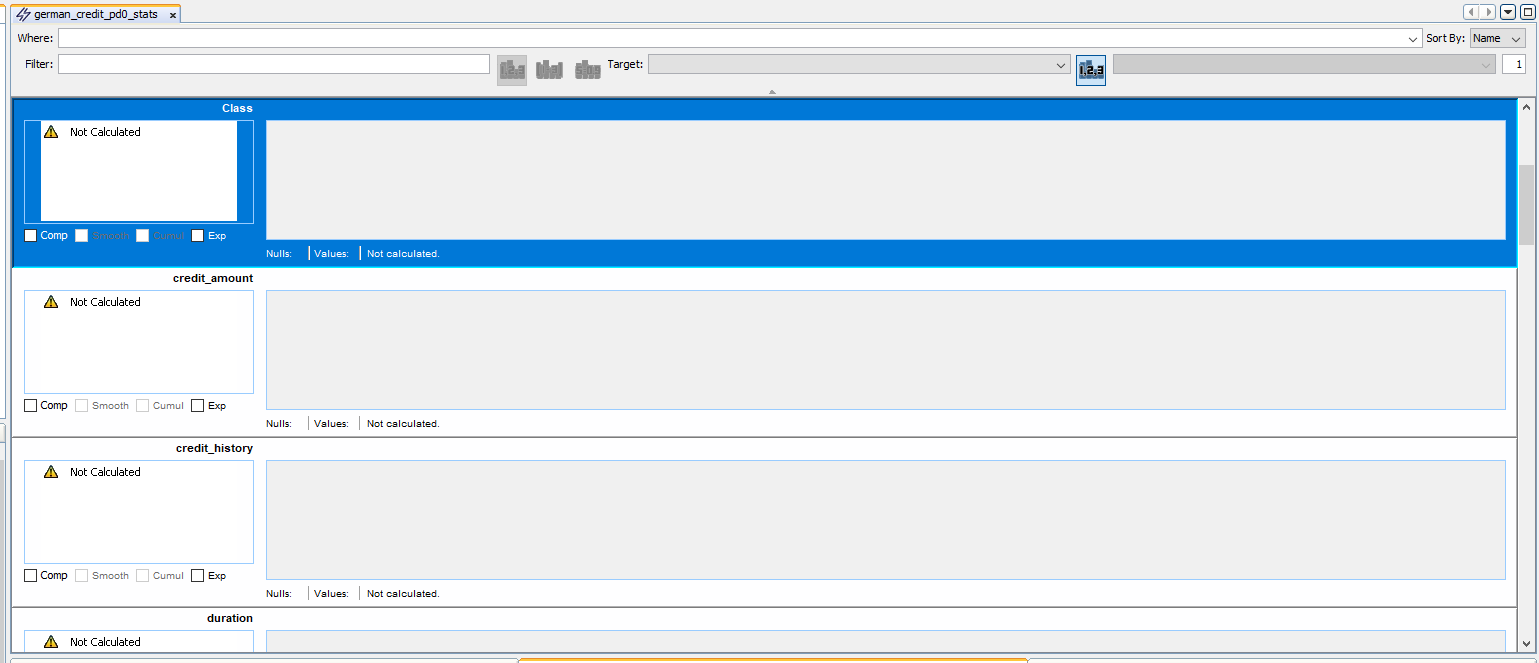
In order to calculate the attributes you need to select the items you are interested in (of course you can choose all of them, although for large tables the calculation of the attributes may take a while) and press the “Execute” button.
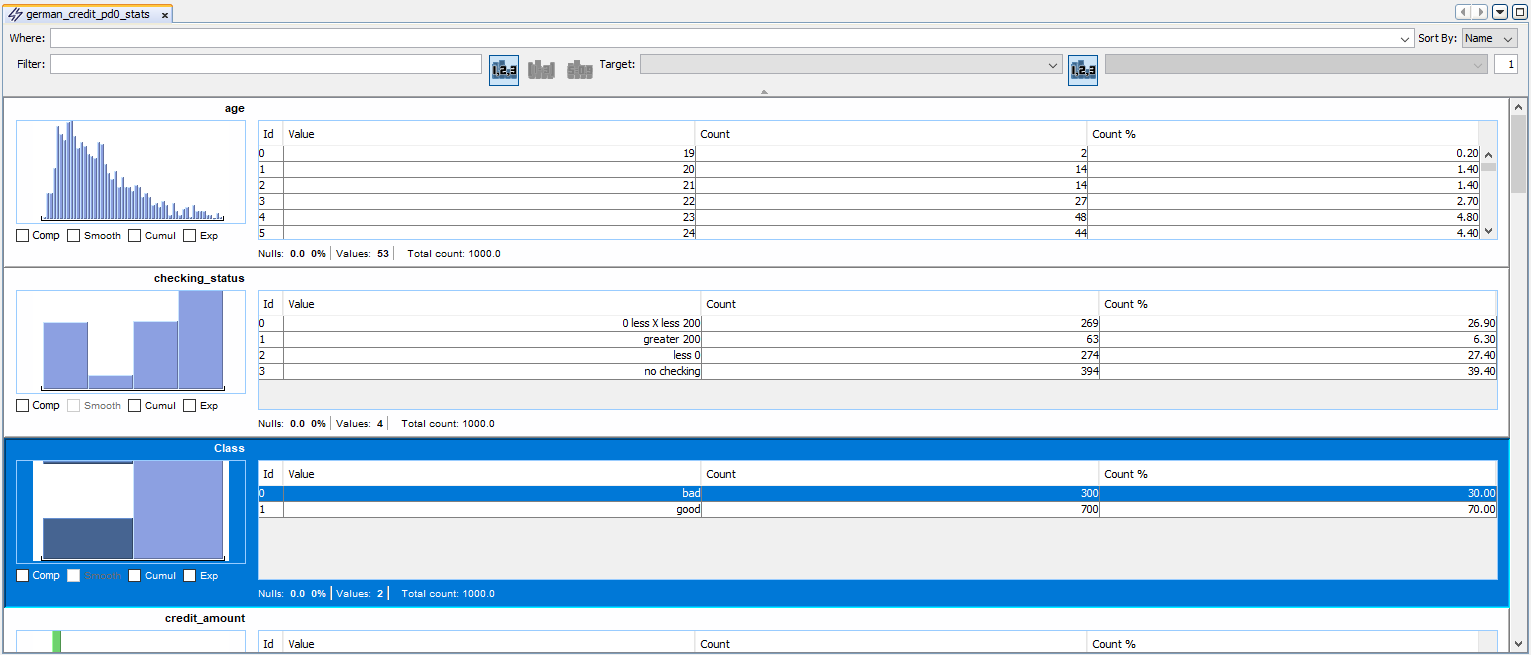
With Freq you can display data in many different forms. In the later part of the post we will move on to more unique features.
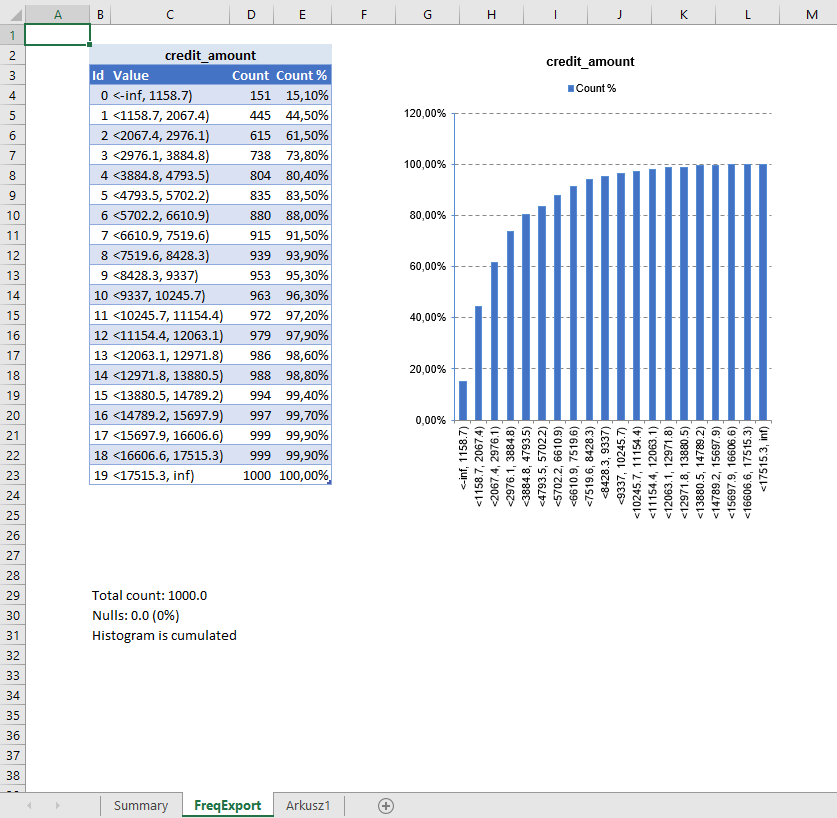
In Freq, we can perform many operations on the attributes, thanks to which we can create graphs. However, the presentation of a chart preceded by the launch of AdvancedMiner and then Freq is not a pleasant perspective. Fortunately, Freq allows you to export data to Excel. To accomplish this, select “Export” from the list of context scripts, which will automatically launch Excel with the sheet containing our graph.

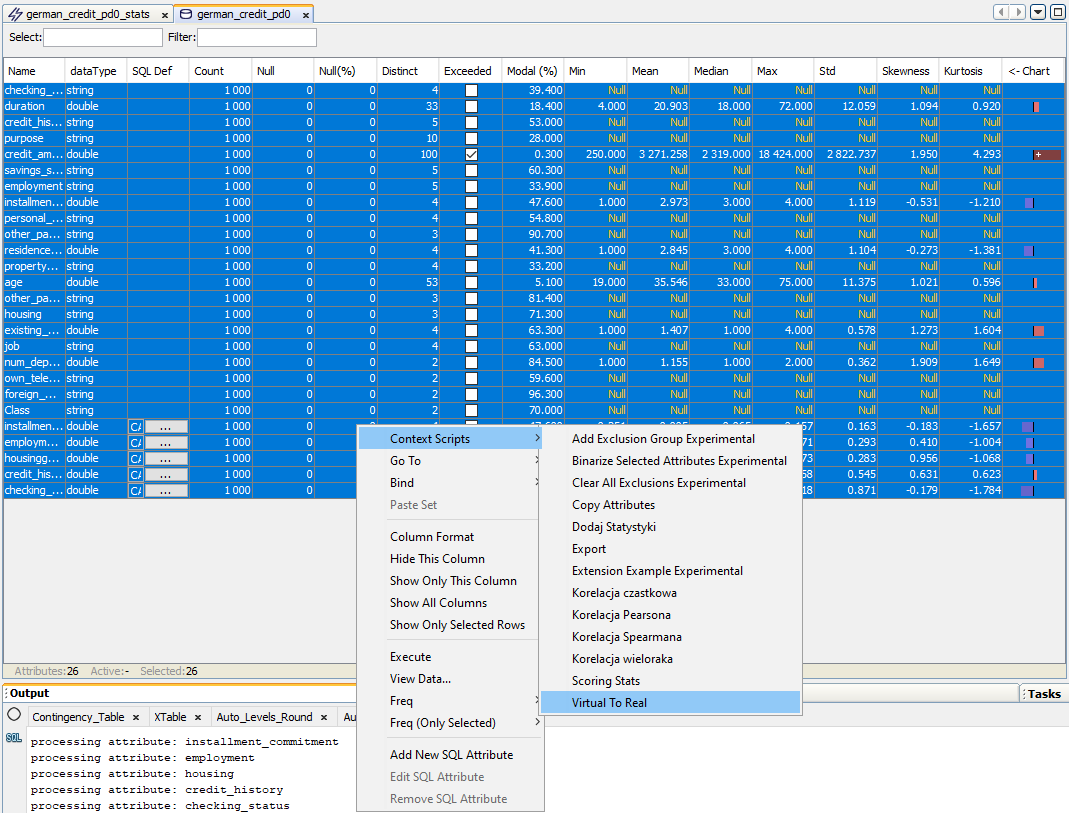
Grouping of variables can also be done by using the following context scripts:
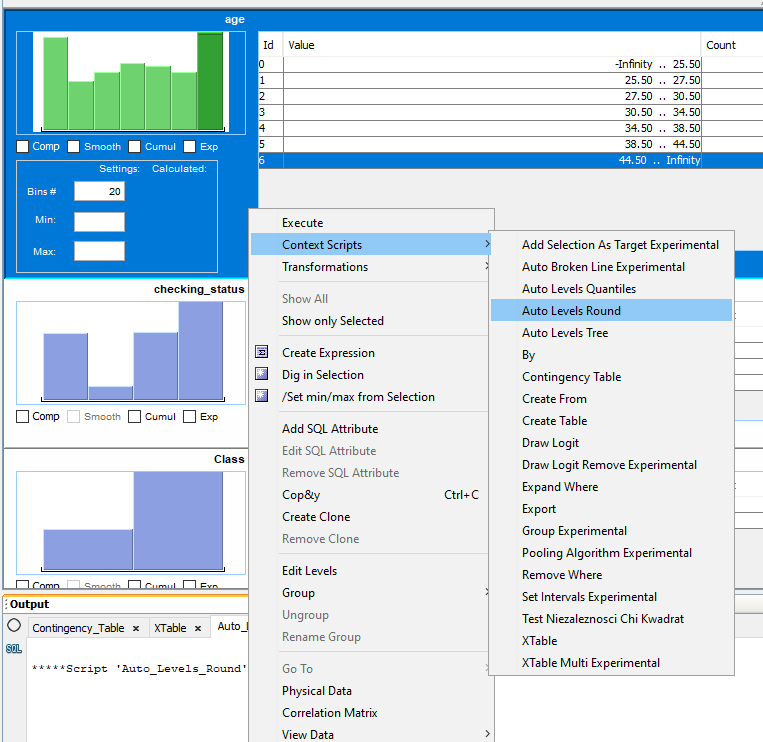
Each of the above options divides the value based on different criteria, for example, the Auto Levels Round asks you to enter the percentage to be cut off from above and below, and then divides the remainder of the value into ranges of equal length. It also asks you to specify how many digits after the decimal point have to be rounded off.
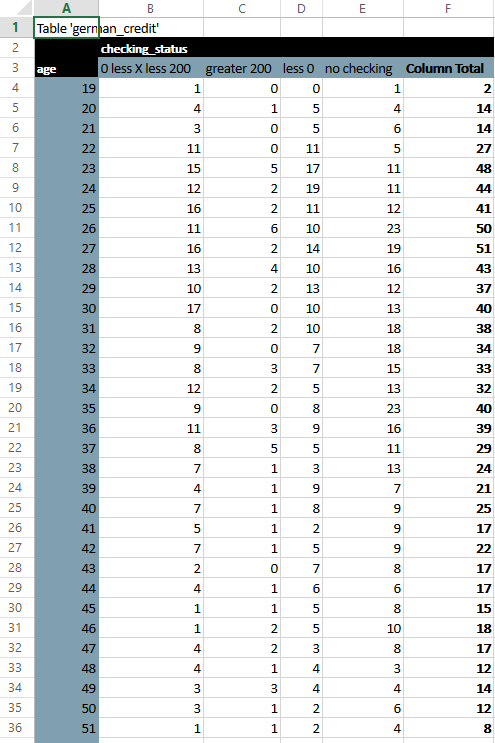
Another interesting context script is a Contingency Table, which can also be exported to Excel.
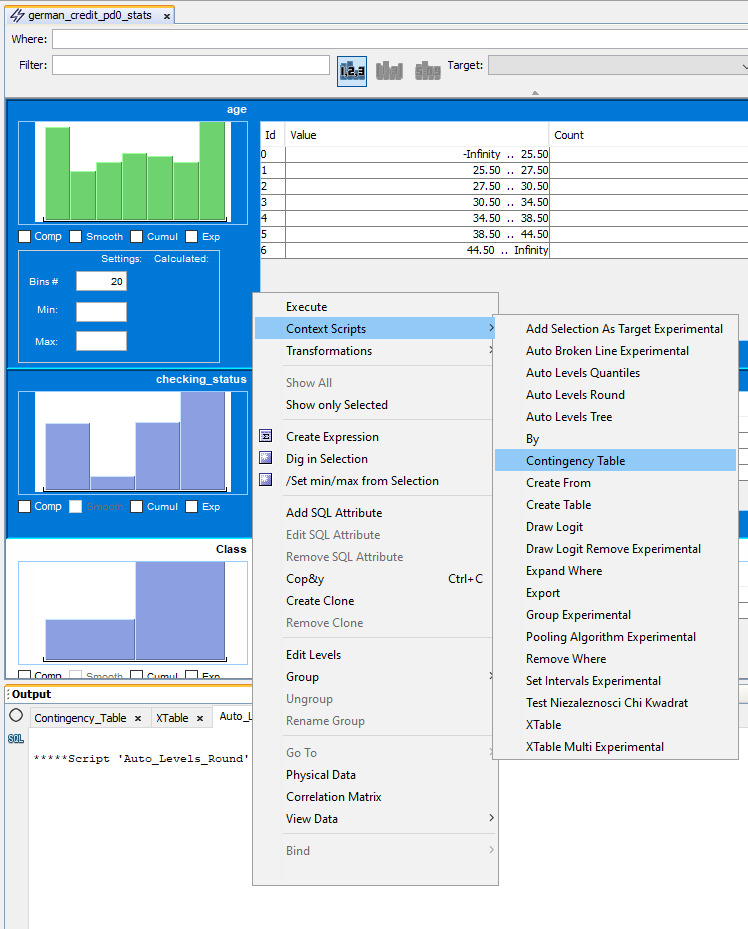
As with “Export”, the file will be opened in Excel.
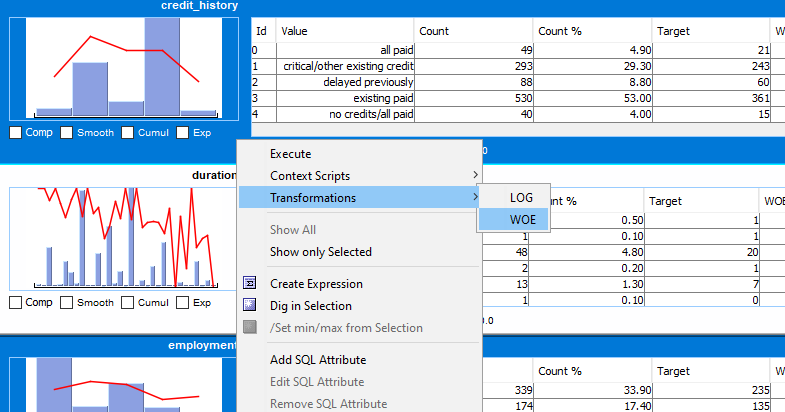
Weight of evidence (WOE) can significantly improve modeling results when dealing with a categorical variable. WOE gives it numeric values and turns it into a continuous variable, linearizing it. WOE is extremely useful if you want to improve results by using logistic regression.
To create a WOE you need to select which attribute is the target, then select everything and click “Execute”.


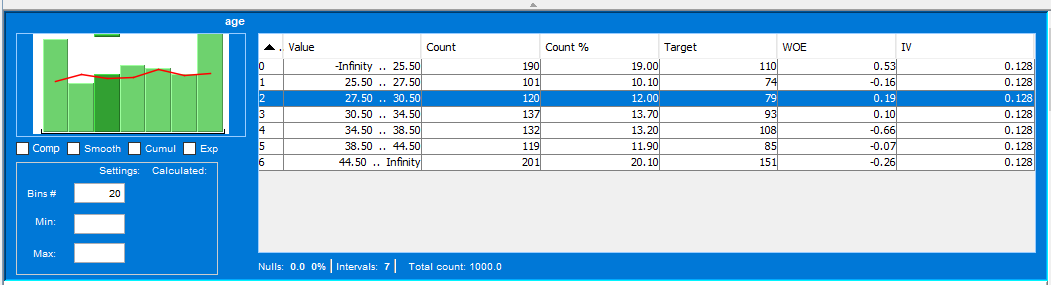
Now on the graph of each variable you can see how the percentage of successes for specific values changes.
Select “Window” in the menu and then “Properties”. On the right side you can see the properties (if the window is empty click on the random Freq place – for example on one of the graphs). Almost at the bottom, select Weight of Evidence.

If you only want to see which WOE value the variables will receive, simply look at the columns next to the graph. WOE values appeared there automatically after selecting Weight of Evidence in properties.
ZUsing the variables in the model is more useful than just analyzing their values, so we will save them to the database. Select the variable, which WOE values you want to use (by holding down Ctrl button you can select multiple items). Then right-click “Tranformations” and then “WOE”. Assign suffix to be added to cloned attributes, select everything and run it.

New variables, which we want to have in the database that will be used in the model, were created.
Right-click and select “Physical Data”. Seeing created WOE variables does not mean that they have been created in the actual database. In order to create a table that contains WOE variables we have to select “virtual to real” from the context scripts.
Now all you need to do is name them. A new database has been created and added to the used alias.
In this post we have presented only a few functions of Freq – we invite you to test the functionality on your own and to read more tutorials and posts on our blog.