
Whisper marketing and influencer marketing are important elements of many marketing campaigns. Dissemination of product information by a friend in specific target groups is much more powerful than advertising targeted directly at all people in a given community. It is natural, that we trust the recommendation of a friend rather than the marketing message of the company. Therefore, it is important to identify people who have the potential to influence their community.
You can search for such groups and influencers on portals such as Facebook or LinkedIn, but there are also other sources of information that can be used (e.g. telecommunication connections). Moreover, it is possible to search for groups that are not formally defined.
Each large population of people is divided into micro-communities. Their members can be assigned specific roles describing their “role” in the community and their ability to disseminate information.
The data defining community is often created naturally by contacting different people, visiting websites, posting content or commenting. Members of the micro-communities influence each other, but some of them have a greater influence than others. They are called influencers. Sending marketing information to an influencer, who will publish the content, is associated with gaining publicity in the micro-community to which it belongs.
AdvancedMiner allows for automated analysis of large databases describing the structure of interpersonal relationships. The databases can contain tens of millions of people and hundreds of millions of connections between them. The result of this analysis will be:
In AdvancedMiner, Social Network Analysis consists of the following steps:
In order to complete the above-mentioned steps, a database table, which stores data on the network structure, is required. The example below has been done by using the YouTube user contact database available on the website: Arizona State University.
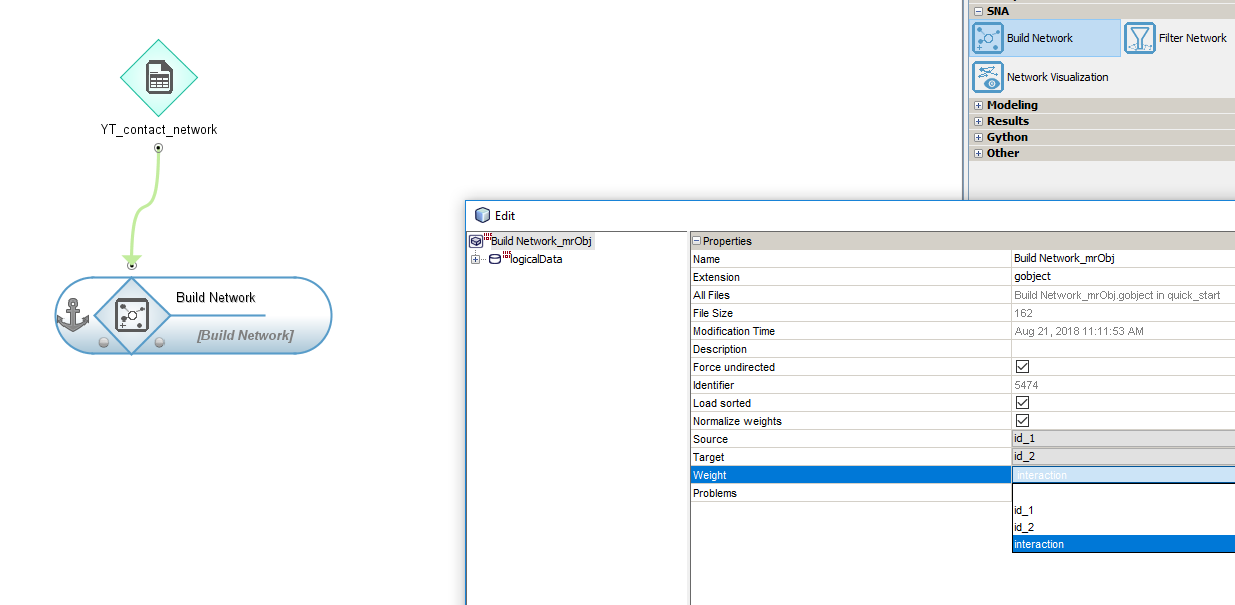
After selecting the table in Workflow and connecting it with the Build Network option from the SNA tab, in the settings, select the fields with the source and target node identifiers. Optionally, you can select third column Weight (by default, all connections’ weight is set to 1).
In some cases it may be necessary to filter in order to obtain a smaller network size. The SNA module allows you to perform this task. You need a database table containing fields with node numbers used to build the network.
In the Filter field, enter the condition according to which the network is to be filtered. It may contain such elements as:
Conditions can be connected by AND and OR operators.
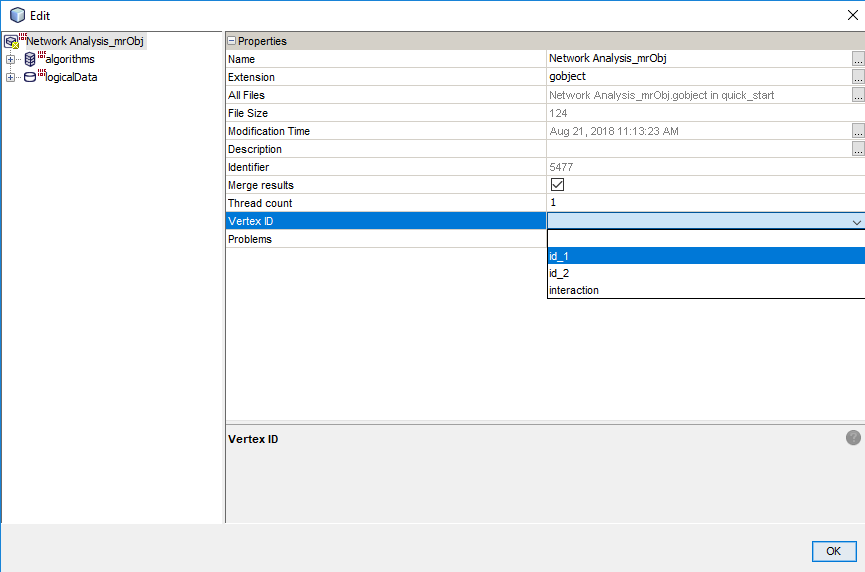
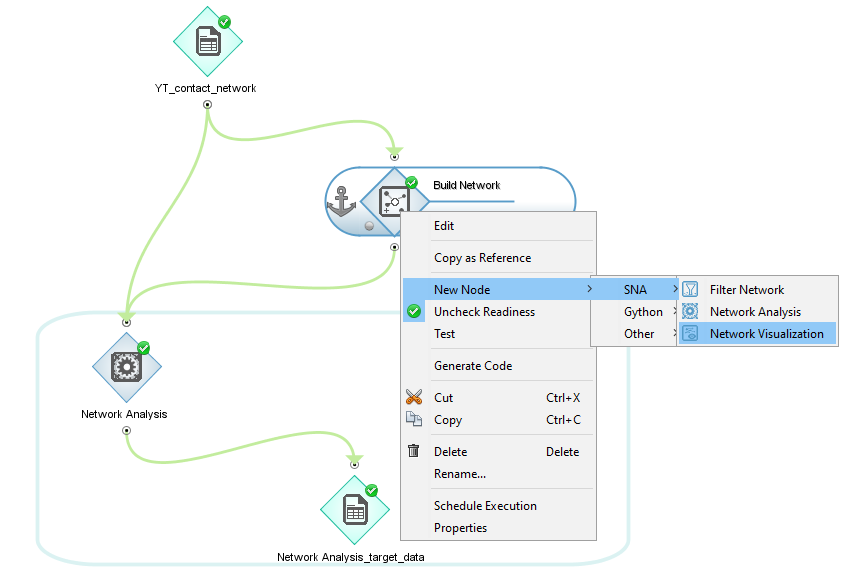
Network analysis is the most important part of the work with networks. To perform it, select Network Analysis from the SNA tab and connect it to the table and the built network. To analyze the data, there are used built-in algorithms. It is possible to use one or more algorithms at once.
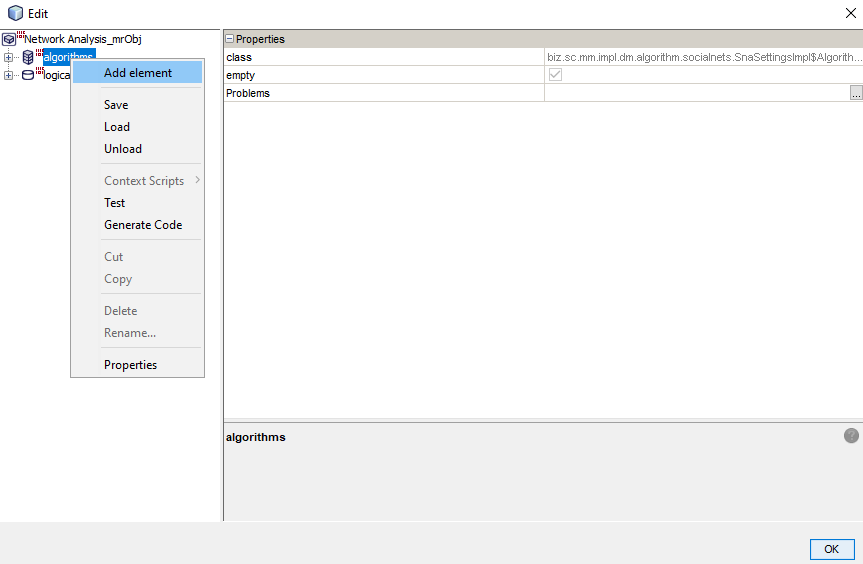
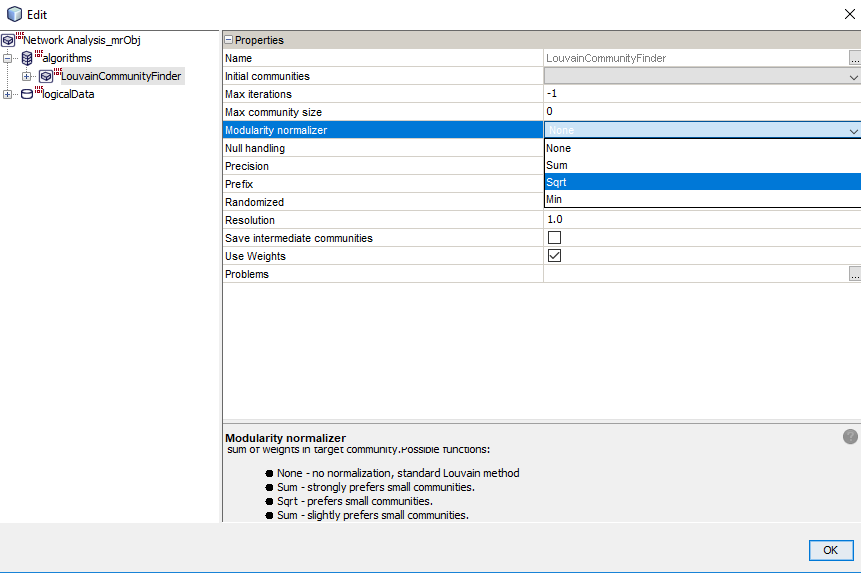
In the analysis menu, select a column containing identifiers that are vertices in the network. Then add an appropriate algorithm and enter the data necessary for its execution.
After pressing F6 a new table containing a column with a selected identifier (vertex) and columns containing information returned by selected algorithms is received.

In order to visualize the network, select Network Visualization. It can be connected to a built network or with executed filtering.
Visualization, in addition to presenting the network, can also present different types of variables and statistics related to network nodes or subnetworks, such as communities, roles. In order to present additional information to the visualization object, the attributes contained in other tables should be added to the visualization object.

After loading the visualization, you can change the appearance of the presented graph with the sliders at the bottom of the window. The toolbar at the top of the window allows you to filter nodes, add supplementary data, launch the Freq tool or take a screenshot of the visualization window.
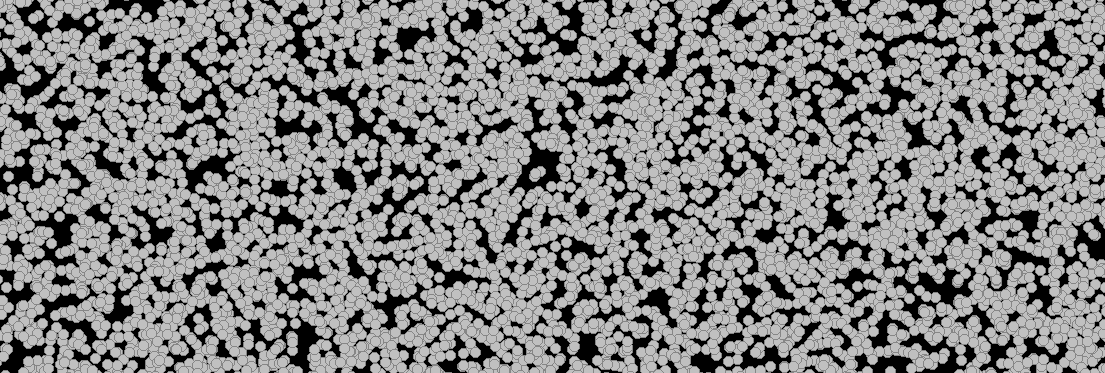
Visualised large network without the use of a navigator.
Press Ctrl+7 to start the navigator. It allows you to customize the content of the visualization.

You can adjust the layout on the Layout tab. There are three different layouts available: ForceDirected, OpenOrd and Random.
Partition enables to divide the network. The network can be divided according to nominal or integer variables. Nodes with different values are assigned different colors.
Ranking is used to visualize additional numerical attributes of nodes. You can change the size of nodes, colors or even their saturation.
Label is a tab where it is possible to add labels with selected values of selected network attributes.
Application of ForceDirected layout and division of the network into communities.
Application of OpenOrd layout and division of the network into communities.

Application of ForceDirected layout, community division and ranking with resizing of nodes.
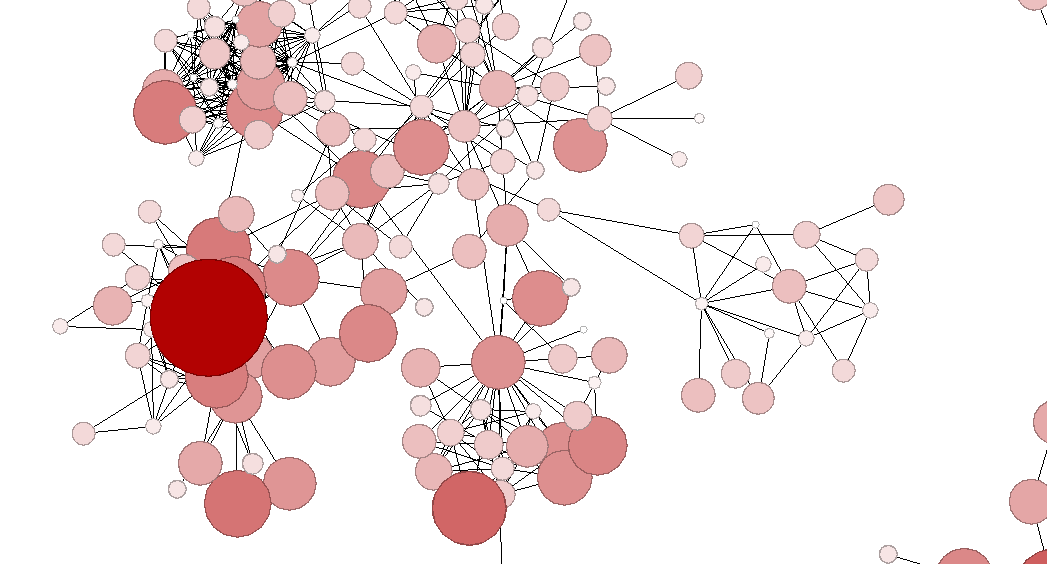
Application of ForceDirected layout, ranking with change of node size and color saturation.

Application of ForceDirected layout, ranking with changing the size of nodes and labels with role names.
To sum up, after a few steps, you will understand how micro-communities are formed. You will find a person, who will make your campaign reach the widest possible audience. By using many algorithms, you will learn numerous statistics about each of the members of a given network, community and links between nodes.
The source of the used data set:
R. Zafarani and H. Liu, (2009). Social Computing Data Repository at ASU [http://socialcomputing.asu.edu]. Tempe, AZ: Arizona State University, School of Computing, Informatics and Decision Systems Engineering